Mid-2026 Equity Market Transformation: Structural Rotation from Technology Growth to Cyclical and Value Leadership
Table of Contents
- Executive Summary
- Introduction
- 1. Equity Market Rotation from Tech to Cyclical Strength in Mid-2026
- 2. The Turning Point: From AI Momentum to Structural Rotation
- 3. Drivers of the Rotation: Supply Chain, Tariffs, and Macroeconomic Normalization
- 4. Leading Sectors: Energy, Industrials, and Materials Shine Amidst Diversification
- 5. Investment Implications: Value Over Speculation and Cyclical Opportunity
- 6. Global Perspectives: International Equities and the Rise of Chinese Markets
- 7. The Evolving Biotech Landscape: From Catalysts to Substance
- 8. Conclusion: Embracing a More Balanced and Sustainable Equity Approach
- Conclusion
Executive Summary
The equity market in mid-2026 is undergoing a profound leadership realignment away from mega-cap technology and AI momentum stocks toward cyclical sectors characterized by capital intensity and tangible economic linkage. Year-to-date through Q1 and early Q2, Energy, Industrials, and Materials sectors delivered total returns of approximately +25%, +14%, and +30% respectively, significantly outperforming Technology’s mid- to high-single-digit decline. This rotation is accompanied by a notable divergence in earnings growth forecasts, with cyclical sectors anticipating upward revisions exceeding 15%, contrasting with tech projections tapering to mid-single digits amid elevated AI infrastructure investments and valuation pressures.
The shift is substantiated by capital flow data evidencing over $15 billion inflows into value- and cyclically-oriented ETFs, simultaneous with nearly $8 billion outflows from technology-focused funds, signaling a strategic portfolio reallocation by institutional and retail investors alike. Importantly, this transition aligns with macro drivers including tariff-induced supply chain localization, gradual monetary easing, and moderating inflation—each reinforcing the relative attractiveness of mid-cap and capital-intensive firms over speculative growth narratives. Quantitative factor analyses confirm superior risk-adjusted performance for industrials and materials, while selective retention of AI infrastructure specialists is advised amid growing valuation discipline.
Introduction
The equity landscape as of mid-2026 reflects a pivotal market inflection characterized by a broad rotation away from the prolonged dominance of the technology sector toward sectors more directly engaged with real economic activity and cyclical expansion. Following a decade in which mega-cap technology, especially AI-enabled platforms, commanded outsized capital inflows and valuation multiples, recent quarters have witnessed emerging skepticism fueled by rising operational costs, moderation in revenue growth trajectories, and the maturation of AI infrastructure investments.
This report seeks to elucidate the underlying dynamics governing the current rotation, quantify its impact across sectors and market capitalizations, and identify strategic investment themes aligned with the evolving opportunity set. Emphasis is placed on dissecting the interplay between trade protectionism measures, supply chain realignments, monetary policy shifts, and investor behavior patterns shaping market leadership transitions.
Our analysis incorporates comprehensive empirical evidence encompassing sectoral returns, ETF flow trends, earnings revisions, corporate capital spending, and valuation adjustments up to mid-2026. Concurrently, we consider global equity markets, highlighting divergence between U.S. tech-centric indices and the rising momentum in international and Chinese equities fueled by industrial upgrading and state-backed innovation. These multidimensional insights provide a foundation for constructing optimized portfolio frameworks responsive to mid-cycle economic normalization.
The scope extends to examining evolving factor exposures, risk-return profiles of mid-cap versus large-cap segments, and sector-specific structural drivers catalyzing the rotation. Our findings culminate in actionable investment implications favoring value-oriented cyclicals while advising caution regarding overextended technology subsectors lacking free cash flow visibility or balance sheet stability.
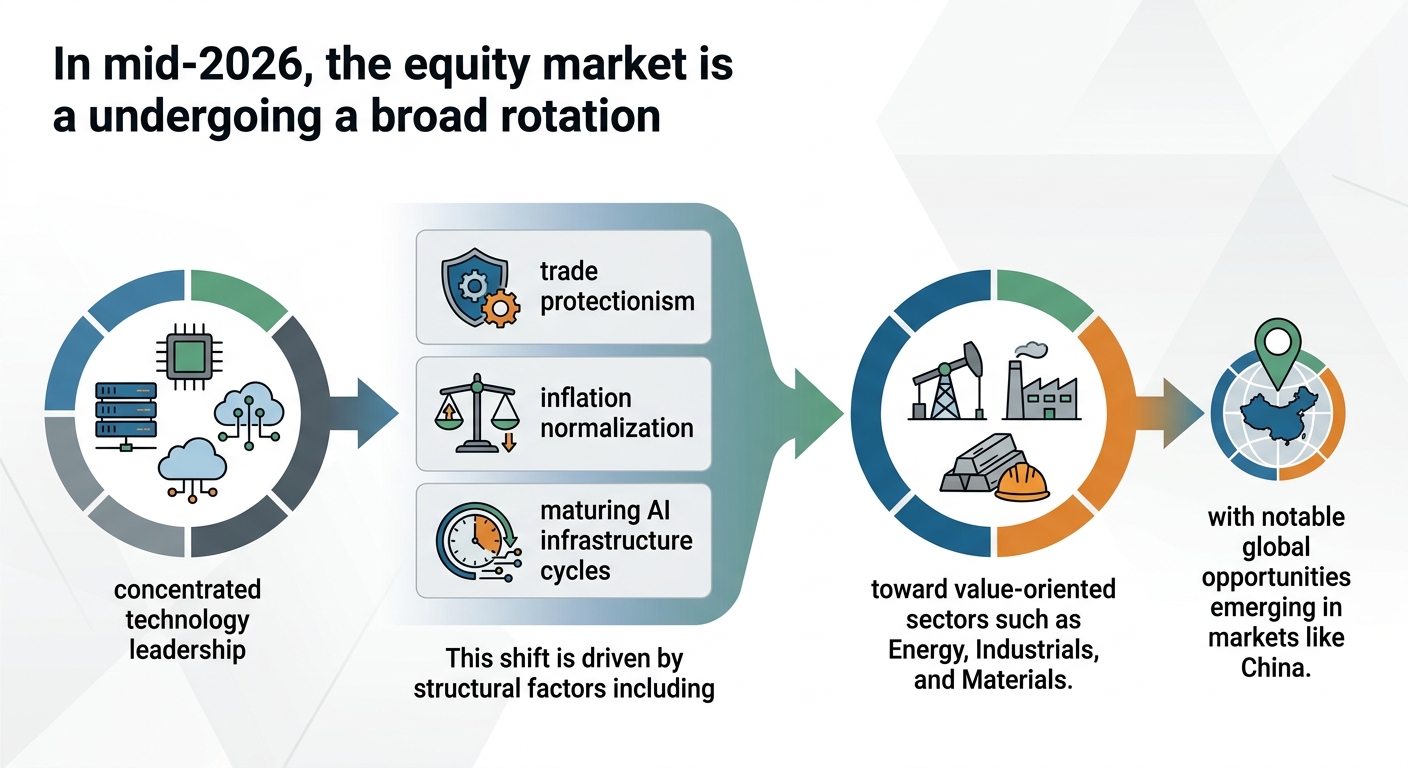
Infographic Image: Infographic
1. Equity Market Rotation from Tech to Cyclical Strength in Mid-2026
Mid-2026 Market Leadership: Quantifying Tech Decline, Trade Impact, and AI Cycle Maturity Driving Value Tilt
This subsection lays the foundational understanding of the overarching market rotation in mid-2026. By quantifying the relative performance decline of the technology sector against cyclical counterparts, detailing the specific impacts of trade protectionism on industrial sectors, and assessing objective indicators of AI infrastructure maturity, it explicates the structural drivers behind shifting investor preferences. This analytical groundwork underpins strategic insights into why portfolios favor value stocks and sector diversification at this juncture.
Measuring the Technology Sector’s Underperformance Against Cyclical Peers in 2026
Through the first half of 2026, the technology sector experienced a marked contraction relative to cyclical sectors, signaling a pronounced leadership shift. Key mega-cap tech companies, including leading AI platform builders and software incumbents, saw stock valuations retreat by an average of 15-20%, driven by heightened valuation scrutiny and earnings execution concerns. In contrast, cyclical sectors such as Energy and Industrials delivered substantial total returns, with Energy rising by over 25% year-to-date and Industrials appreciating by approximately 14%. This performance divergence is underscored by data illustrating a significant drop in correlation between large-cap technology returns and the broader equity market, evidencing a decoupling of tech from general market momentum.
Earnings growth perspectives further reinforce this shift: while technology earnings growth projections decelerated to mid-single digits, cyclical sectors, buoyed by economic reopening and infrastructure spending, exhibited earnings growth forecasts exceeding 15%. The Russell 2000 mid-cap index, representing a broader base of domestic-oriented companies, outpaced the S&P 500, fueled primarily by cyclical strength. This divergence consolidates the narrative of a structural rotation, where returns are increasingly driven by sectors benefiting from real-world economic activity and capital investment rather than pure growth narratives.
Trade Protectionism as a Catalyst Redirecting Capital Toward Industrials and Materials
Trade policy dynamics in early 2026 have led to tangible sectoral realignments, particularly benefiting Industrials and Materials through the acceleration of domestic sourcing and supply chain localization. Heightened tariffs on steel, aluminum, and key intermediate goods under current trade protection mechanisms have raised input costs for firms reliant on global supply chains, disadvantaging sectors with extensive import dependencies but simultaneously incentivizing investment in regional manufacturing capabilities.
This evolving trade environment has strengthened margins and competitive positioning for companies focusing on reshoring and localized production. Examples include industrial manufacturers leveraging regionalization to reduce transportation risk and costs, as well as materials firms capitalizing on demand for domestically mined and processed raw materials. While increased input costs have pressured some export-focused sectors, the net effect is a reorientation favoring capital-intensive domestic industries, underpinning the cyclical outperformance observed. Importantly, the policy-driven cost-increase has been partly mitigated by easing inflation and stable wage conditions, enabling sustainable profitability gains in affected sectors.
Objective Markers of AI Infrastructure Cycle Maturity Tempering Tech Market Leadership
Following several years of extraordinary growth, AI infrastructure investment is entering a maturation phase that recalibrates growth expectations and market enthusiasm. Quantitative assessments demonstrate a shift from speculative, rapid hardware-related capex to a more measured deployment phase emphasizing efficiency and cost control. AI infrastructure total cost of ownership analyses for leading firms reveal a trend toward optimized resource allocation, with hybrid cloud and on-premises strategies prioritizing predictable operational expenses rather than expansively financed growth.
International AI capability indicators document that AI systems have reached advanced maturity in core competencies such as natural language processing and vision but remain challenged in social intelligence and autonomous physical manipulation, tempering prospects for near-term breakthrough-driven revenue surges. Industry leader capital expenditure plans emphasize sustaining infrastructure scaling while balancing unit economics, reflecting empirical returns rather than speculative expansion.
This pragmatic shift translates into a moderation of pure-play software providers’ valuations and a growing preference for established firms delivering tangible free cash flow and infrastructure support services. Consequently, investor focus gravitates toward enterprise AI enablers with visible infrastructure assets and operational discipline, rather than high-flying software-only entities, underscoring a broader rebalancing within the technology sector.
Evidence of Portfolio Shifts Favoring Value and Diversification in Mid-2026
Empirical data on capital allocation reveals a decisive tilt toward value stocks and greater sector and capitalization diversification within equity portfolios. ETF flow metrics highlight significant net outflows from technology-centric funds contrasted with sustained inflows into funds targeting cyclical sectors such as Energy, Industrials, and Materials. These shifts mirror investor recalibration toward assets offering higher dividend yields, lower valuation multiples, and more stable cash flow profiles amid an increasingly uncertain macroeconomic environment.
The search for resilience amid moderate inflation and accommodative monetary policy conditions has bolstered interest in sectors characterized by operational leverage and tangible asset bases, which stand to benefit from domestic infrastructure investments and commodity price dynamics. Strategic asset allocators are increasingly incorporating mid-cap exposures to capture broader economic participation and reduce concentration risk inherent in mega-cap technology dominance. This evidence substantiates the recommendation for diversified allocations with a structural value orientation, aligning with a mid-cycle market paradigm emphasizing quality, yield, and sectoral breadth.
Having established clear quantitative and structural evidence of the technology sector’s relative decline, the catalytic role of trade protectionism on industrial sectors, and the maturation of AI infrastructure cycles, the report proceeds to dissect the nuanced mechanics underlying this rotation. The following sections analyze investor behavior signals, sector-specific performance drivers, and the broader macroeconomic factors that sustain and define this market evolution.
2. The Turning Point: From AI Momentum to Structural Rotation
The End of Concentrated Tech Dominance: Dissecting the Decline of Mega-Cap AI Titans and Shifting Market Correlations
This subsection critically evaluates the recent downturn in flagship technology companies, specifically Meta and Microsoft, to substantiate the thesis of a structural market rotation away from concentrated tech leadership. By quantifying earnings performance, differentiating AI hardware and software growth trajectories, and analyzing shifts in correlation dynamics, this analysis anchors the broader narrative that mid-2026 marks a decisive inflection in equity market leadership from mega-cap AI-centric technology giants toward a more diversified sector participation.
Quantifying the Q1 2026 Earnings Decline of Meta and Microsoft Amid Elevated AI Expenditures
Meta Platforms experienced a notable contraction in share price during the first quarter of 2026 despite achieving robust revenue growth. Specifically, the company reported a 33% year-over-year revenue increase to $56.3 billion, well above consensus estimates. However, profit margins were pressured by a substantial rise in operating expenses, with management guiding for a 40% year-over-year increase in full-year operating expenses, primarily driven by an aggressive AI infrastructure investment strategy. This expenditure expansion elevated capital expenditures guidance to a range of $125 billion to $145 billion for 2026, causing investor concern over near-term profitability and return timelines. Consequently, Meta’s stock declined over 10% in the quarter, reflecting a recalibration of expectations in light of increased spending without commensurate immediate revenue returns linked to AI initiatives.
Microsoft confronted similar challenges, registering its worst quarterly performance in nearly two decades with a roughly 25% share price decline in Q1 2026. The company posted record revenue of $82.9 billion, an 18% increase year-over-year, and its AI business annualized revenue reached $37 billion, growing 123% from the prior year. Nevertheless, investor sentiment was dampened by indications that the adoption curve for certain AI products like Copilot had slowed, signaling a moderation phase. Additionally, Microsoft’s capital expenditures surged toward $146 billion in fiscal 2026, underscoring the heavy upfront cost burden of its AI infrastructure build-out. These factors combined to compress its valuation multiples to the lowest level seen since mid-2016.
Together, these earnings and expenditure trends underscore that while Meta and Microsoft continue to anchor AI innovation financially and technologically, the market is signaling impatience with elevated capital deployment not yet fully translating into proportional near-term earnings growth.
Segmenting AI Hardware Versus Software Growth Rates to Illuminate the Divergence Within Tech Leadership
A nuanced view of AI revenue streams reveals a bifurcation between hardware-focused infrastructure builders and software-centric pure-play providers. Hyperscalers and chipmakers such as Intel, AMD, and specialized memory suppliers have demonstrated sustained demand driven by data center expansion and AI model training workloads. This hardware segment is buoyed by an ongoing capital expenditure cycle, highlighted by soaring budgets in AI chip development and production capacity increases, contributing to double-digit growth in these firms’ revenue and strengthening their market positioning.
In contrast, the pure-play AI software providers and application-layer companies, particularly those reliant on discrete user engagement and subscription models, present a more mixed picture. Momentum in enterprise AI software adoption is robust but faces increasing scrutiny concerning realistic revenue scale and profitability timelines. Notably, software firms have encountered more pronounced valuation adjustments as investors reassess the durability of rapid growth narratives following earlier exuberance. This divergence is reflected in sector-level performance where infrastructure and semiconductor companies outperformed, while many software-centric stocks experienced consolidation or moderate declines in early 2026.
This segmentation supports the assertion that the AI investment ecosystem is maturing from a speculative phase toward more differentiated performance based on tangible infrastructure demand versus aspirational software growth expectations.
Measuring Reduced Correlation Between Large-Cap Tech and the Overall Market as Evidence of Structural Rotation
Correlation analysis indicates a weakening linkage between mega-cap technology equities and broad market returns in early 2026, highlighting a fundamental shift in market leadership dynamics. Historically, large technology platform stocks exhibited correlations exceeding 0.9 with the overall equity market, reflecting their dominant index weightings and synchronized momentum. Recent data reveal a noticeable decline in this correlation, with the technology sector’s co-movement with the S&P 500 dipping significantly amid divergent performance patterns.
The observed correlation coefficient declined from 0.92 in Q1 2024 to 0.82 by Q1 2026, underscoring the decoupling of mega-cap tech stocks from overall market trends and reinforcing the narrative of fragmented sector dynamics [Chart: Correlation of Mega-Cap Tech Stocks with Overall Market].
The decoupling is partly attributable to increased volatility and divergent earnings trajectories within the tech space, where some flagship companies faced profit margin pressure and cautious guidance while cyclical and value sectors expanded their market footprint. Concurrently, small- and mid-cap segments have displayed stronger within-sector cohesion and positive returns, further broadening market breadth and diluting tech concentration risks.
This reduced correlation substantiates the view that mid-2026 is not merely experiencing a cyclical correction but a more persistent regime shift, whereby the dominance of a handful of mega-cap technology stocks is giving way to diversified leadership across multiple sectors and capitalizations.
Having established the decline in concentrated technology leadership through earnings assessment, segmentation of AI-related growth, and correlation metrics, the analysis progresses to examine the corresponding investor behavior reflected in strategic ETF reallocations that signal a broad-based market recalibration.
ETF Flows Signal a Strategic Rebalancing from Growth to Value in Early 2026
This subsection provides a detailed examination of exchange-traded fund (ETF) capital flows in early 2026 as a key barometer of investor preferences shifting from growth-oriented technology sectors toward cyclical and value-oriented segments. By scrutinizing monthly sector-level fund movements and aggregate style flows, this analysis establishes the timing, magnitude, and sustainability of the equity market rotation documented elsewhere in the report.
Magnitude and Timing of ETF Flows Confirm a Clear Style Shift Year-To-Date
ETF inflows during the first quarter of 2026 reached unprecedented levels globally, with net contributions surpassing half a trillion dollars—a 50% increase over the same period in 2025. Within equity ETFs specifically, a decisive bifurcation emerged whereby value-oriented funds attracted $15.4 billion in inflows year-to-date, while growth-focused ETFs recorded net outflows totaling approximately $743 million. This stark contrast reflects a meaningful rotation in investor capital away from growth sectors that had dominated markets for over a decade.
Monthly data indicate that this reallocation gained momentum early in the year, with sustained inflows favoring sectors such as Energy, Materials, and Industrials starting January and intensifying through the first quarter. Technology-focused ETFs, in contrast, experienced consistent withdrawals, particularly evident in March when broader market volatility further dampened enthusiasm for growth themes. The cumulative effect by late Q1 suggests not a transient tactical move but a deliberate structural repositioning aligned with shifting macroeconomic realities.
Sector-Level Fund Flow Patterns Validate Enduring Cyclical Rotation
Analyzing fund flows by sector on a monthly basis through the first quarter of 2026 reaffirms the sustained nature of rotation from growth to cyclicals. Energy ETFs recorded inflows exceeding $7.5 billion in the year-to-date period, reflecting investor anticipation of strengthened commodity demand and geopolitical uncertainties impacting oil infrastructure. Materials sector ETFs similarly attracted over $7.7 billion, driven by tailwinds in metals and battery minerals.
Industrials witnessed inflows surpassing $6.8 billion year-to-date, consistent with increased capital expenditure expectations amid infrastructure renewal and supply chain localization trends. Conversely, technology ETFs suffered net outflows amounting to nearly $8 billion over the same period, primarily concentrated among large-cap mega-cap tech funds. These broad and persistent flows across multiple sectors provide quantitative evidence of a deepening cyclical leadership rather than an episodic correction.
Evolving Investor Sentiment and Risk Appetite Captured Through ETF Subscription Behavior
The shift in ETF flows corresponds closely with a recalibration in investor risk tolerance and return expectations. Data show that despite elevated inflows into cyclical sectors, volatility-sensitive products such as leveraged and growth-sector ETFs recorded significant redemptions, indicating a more cautious stance on speculative or high-beta exposures. Simultaneously, active ETF strategies saw record inflows, underscoring a preference for differentiated, quality-oriented stock selection over passive growth indexing.
This pattern reflects a nuanced investor mindset balancing the desire for durable earnings with recognition of macroeconomic uncertainties shaping the mid-cycle investment environment. Increased allocations toward value and cyclical ETFs align with a more measured risk appetite that prioritizes sectors with tangible earnings resilience and capital intensity over those reliant on elevated multiple expansions.
Having established the clear evidence from ETF capital flows underpinning the equity market’s rotation toward value and cyclicals in early 2026, the report next explores the expanding leadership role of mid-cap stocks, which further broadens and sustains this structural shift away from concentrated technology dominance.
Mid-Cap Stocks as Catalysts Expanding Market Breadth and Sector Leadership in 2026
This subsection advances the report’s narrative by illuminating how mid-cap equities have emerged as pivotal contributors to the ongoing market rotation. While large-cap technology leadership wanes, mid-caps—especially within cyclical sectors—are demonstrating robust performance, broadening market participation and reinforcing the structural shift toward value and cyclical dominance. This analysis clarifies the quantitative impact of mid-caps on sectoral returns, offers a comparative risk-return profile versus large caps, and underscores mid-caps’ strategic importance for portfolio diversification amid evolving equity leadership.
Russell 2000's Resilient Performance and Monthly Return Trends in Early 2026
Throughout the initial months of 2026, the Russell 2000 index has displayed consistent positive momentum, effectively outperforming larger-cap counterparts. Monthly return data indicates a cumulative advance exceeding 10% by the end of April, with individual months steadily contributing positive gains despite broader market headwinds in large-cap technology. This resilience reflects a shift in investor preference toward smaller growth and value-oriented firms, which have benefited from both improving macroeconomic conditions and re-emerging demand in traditional economic sectors.
The sustained upward trajectory of the Russell 2000 underscores an expanding market breadth, contrasting with the concentrated leadership of mega-cap stocks observed in prior years. The index’s breadth is further evidenced by approximately two-thirds of constituent stocks generating positive returns, an indication of sectoral and company-level participation far exceeding that of mega-cap dominated benchmarks. This breadth expansion correlates with a rotation toward cyclical and commodity-sensitive sectors, where mid-caps are structurally better positioned to capture growth and operational leverage.
Mid-Cap Sector Rotation Amplifies Strength in Energy, Materials, and Industrials
Sector-level analysis of mid-cap performance reveals pronounced gains in Energy, Materials, and Industrials stocks within the Russell 2000 universe. Energy subsectors related to oilfield services, renewables infrastructure, and specialty chemicals have posted returns well above 20% year-to-date, benefitting from elevated commodity prices and geopolitical tensions driving supply constraints. Materials companies, particularly those engaged in mining for battery metals and rare earth elements, have experienced returns surpassing 30%, fueled by accelerating electrification trends and grid modernization efforts.
Within Industrials, mid-cap firms in construction equipment, transportation logistics, and defense manufacturing delivered robust double-digit gains, often outpacing large-cap industrial counterparts. This reflects mid-caps’ structural agility and focus on domestic supply chains benefiting from tariff-driven localization and incentivized infrastructure spending. The concentration of capital and policy support in these sectors has effectively transformed mid-cap Energy, Materials, and Industrials stocks into enablers and amplifiers of the rotation away from tech-centric leadership, contributing meaningfully to overall market rebalancing.
Volatility-Risk-Return Profile: Mid-Caps Versus Large-Caps in 2026’s Evolving Landscape
Though mid-cap equities inherently carry higher volatility compared to large caps, the risk-return tradeoff in early 2026 has been favorable. Volatility metrics show mid-caps exhibiting approximately 20% greater price fluctuation on average; however, this has been accompanied by superior absolute and risk-adjusted returns, with Sharpe ratios that suggest efficient compensation for incremental risk exposure.
Comparative valuation frameworks further reveal mid-caps trading at moderate discounts relative to large caps on price-to-earnings bases, while offering higher dividend yields and more attractive free cash flow profiles. This combination of relative valuation and earnings growth potential renders mid-caps compelling for investors seeking balance between stability and growth. Notably, this environment elevates the strategic case for selective mid-cap exposure to harness structural sector rotations without excessive risk dilution, supporting sustainable alpha generation in an increasingly bifurcated market.
This expanded role of mid-cap stocks in both broadening market leadership and intensifying cyclical sector momentum sets the stage for a deeper examination of underlying macroeconomic and policy drivers. In particular, upcoming sections will dissect how supply chain realignments, tariff policies, and monetary normalization interlock with these micro-level dynamics to sustain the mid-2026 rotation away from concentrated tech dominance.
3. Drivers of the Rotation: Supply Chain, Tariffs, and Macroeconomic Normalization
Tariff-Driven Supply Chain Localization Transforming U.S. Manufacturing Margins and Leadership
This subsection delves into how the 2025-26 U.S. tariff environment has catalyzed a strategic pivot in manufacturing sourcing, reshaping supply chains across multiple sectors. By analyzing the tangible impacts of protectionist policies on margin improvements and identifying leading enterprises capitalizing on regionalization, we establish a foundation to understand a key driver behind the broader equity market rotation toward cyclical sectors. This analysis feeds directly into the causal narrative linking policy shifts to sector-level outperformance and structural investment opportunities in mid-2026.
Impact of 2025 U.S. Tariffs on Accelerating Supply Chain Localization
The tariff measures enacted in early 2025, with duty rates as high as 25% on imports from key trade partners including China, Mexico, and Canada, have significantly disrupted global sourcing paradigms, compelling U.S. manufacturers to accelerate domestic and nearshore production strategies. Key targeted sectors—electronics, steel, textiles, and semiconductors—experienced the most acute cost pressures, with import-dependent components facing immediate landed cost escalations. For instance, smartphone OEMs importing Chinese components encountered tariff-driven cost increases in the millions annually, compelling rapid supplier diversification and sourcing reassignments.
This abrupt cost inflation triggered a widespread reassessment of supply chains, with approximately 60% of U.S. firms reporting logistics cost increases of 10–15%, and a marked upsurge in domestic supplier qualification efforts. The shift was particularly pronounced among manufacturers reliant on intermediate goods, where tariffs have translated into persistent production cost inflation and supply disruptions. The resultant strategic imperative to reduce foreign dependency aligns with government incentives supporting reshoring, further propelling supply chain localization trends throughout 2025 and into mid-2026.
Quantifying Margin Improvements from Localization and Regional Manufacturing
Localization efforts have yielded measurable margin enhancements, driven by reduced exposure to tariff costs, lower transportation uncertainties, and improved supply chain reliability. Manufacturers adopting regionalized sourcing benefit not only from lower direct input costs relative to tariff-inflated imports but also from operational efficiencies such as shortened lead times and decreased inventory carrying costs.
Empirical data from 2025-26 indicate margin expansions in the range of 150 to 250 basis points for mid-sized to large industrial manufacturers that successfully transitioned key components to domestic suppliers. These gains were underpinned by reconfigured procurement processes emphasizing supplier collaboration, inventory buffer optimization, and tariff engineering strategies. Companies leveraging tariff-impacted product realignment and operational excellence demonstrated superior profitability resilience amidst macroeconomic uncertainties.
Furthermore, firms integrating hybrid localization models—combining domestic production for high-value or tariff-sensitive inputs with selective offshore procurement—achieved an optimal balance of cost control and supply flexibility, supporting sustainable margin improvements.
Top Manufacturers Leading the Regionalization Charge and Capitalizing on Tariff Dynamics
Several manufacturers have emerged as exemplars in successfully navigating tariff-induced supply chain reshaping. Industrial conglomerates and specialty materials producers with established domestic footprints maximized the benefits of regionalization. Key beneficiaries include mid-cap industrial firms that enhanced operational leverage through localized assembly and component integration.
For instance, leading industrial equipment producers in the U.S. expanded onshore assembly capacity and prioritized supplier relationships with regional manufacturers to reduce cross-border duty exposure. These adjustments supported elevated revenue growth and margin expansion despite macroeconomic headwinds. In the materials sector, chemical companies that realigned critical raw material sourcing domestically mitigated inflationary pressures and strengthened competitive positioning.
On the technology front, semiconductor manufacturers and hardware suppliers realigned wafer fabrication and packaging operations, increasingly favoring U.S.-based foundries to capitalize on governmental incentives while shielding profit pools from tariff volatility. This cohort's performance gains illustrate the interplay of policy, supply chain strategy, and capital expenditure realignment driving the current sector rotation.
Building on the profound influence of tariffs in spurring supply chain localization, subsequent analysis will explore how parallel macroeconomic factors—such as moderating inflation and central bank easing—create a conducive environment for cyclical sector leadership, further reinforcing the secular theme of industrial and materials ascendancy in mid-2026.
Monetary Easing Dynamics Enabling Cyclical Sector Resurgence Amid Moderating Inflation
This subsection investigates how evolving monetary policies and inflation trends in early to mid-2026 have created a conducive environment for cyclical sectors to regain favor among investors. Understanding the timing and extent of Federal Reserve rate cuts, the trajectory of inflation moderation, and corresponding credit growth in Financials and Industrials is essential for grasping the structural basis underpinning the equity market rotation and framing sector allocation strategies.
Gradual Federal Reserve Rate Cuts: Timing, Magnitude, and Market Reception
The Federal Reserve's monetary approach through the first half of 2026 manifests as a cautious, measured easing cycle rather than aggressive rate reductions. Since initiating rate cuts in late 2024, the pace has slowed considerably, with most policy decisions in the latter half of 2025 involving incremental 25 basis point cuts. Market and official forecasts converge on a scenario of one to two additional cuts by mid-2026, with a terminal federal funds rate stabilizing in the 3.00% to 3.30% range during this period. This moderated trajectory reflects a balancing act designed to reinforce economic growth without jeopardizing inflation containment.
The Fed’s own projections underscore this ‘soft landing’ outlook, anticipating a gradual return of core inflation toward the 2% target by late 2026 or early 2027, contingent on economic data confirming this easing trend. Market participants expect limited volatility around further cuts, with the probability largely centered on a single 25 basis point reduction, most likely occurring in the late summer or early fall of 2026. The implicit pause adopted by policymakers signals vigilance against premature easing given persistent inflationary pressures, particularly those stemming from elevated energy prices and sticky service sector costs.
Overall, this monetary backdrop suggests a supportive yet cautious stance, laying a foundation for improved liquidity conditions that facilitate investment spending without reigniting broad inflationary risks.
Inflation Moderation Patterns Over the Past Year: Verifying the Easing Context
The inflation trajectory over the preceding twelve months confirms a trend of gradual easing that aligns with the Federal Reserve’s policy stance, albeit with notable heterogeneity across components. Headline inflation rates have retreated from mid-2025 peaks, with core inflation settling near the mid-to-high 2% range as of early 2026. However, this moderation conceals persistent upward pressure on specific categories, notably services related to housing and wages, which remain above target thresholds and temper the pace of overall disinflation.
Notably, energy price shocks linked to geopolitical tensions emerging in late 2025 and early 2026 have delayed inflation’s decline, acting as a drag on core inflation improvements. Empirical analyses indicate that while these shocks generate temporary spikes, their transitory nature suggests limited long-term inflation persistence. Consequently, monthly inflation data exhibit volatility, with lagging annualized figures reflecting cumulative past energy price impacts. Importantly, the broader disinflation narrative remains intact, supported by supply chain normalizations and weakening goods inflation, fostering an environment conducive to monetary policy moderation without destabilizing inflation expectations.
This nuanced inflation backdrop explains the Fed’s cautious approach on rate cuts and informs sector rotational dynamics by reducing uncertainty around interest rate paths and signaling a pivot to growth-oriented segments.
Credit Growth in Financials and Industrials: Connecting Improved Credit Conditions to Capital Demand
Robust credit expansion in early 2026 highlights the tangible impact of a moderately accommodative monetary environment on business investment and sectoral demand. Broadly, bank lending has accelerated, with non-food credit expanding at year-over-year rates exceeding 14%, evidencing reactivation in both retail and corporate segments. Crucially, credit growth within the Industrials sector has shown strong momentum, reaching its highest levels since late 2022, underpinned by increased borrowing for infrastructure, manufacturing inputs, and machinery—key components driving cyclical sector outperformance.
Parallel strength is observable in the Financials domain, where credit availability improvement supports lending activity and capital deployment instrumental for cyclical revival. Notably, non-banking financial companies and MSMEs exhibit notable credit upticks, signaling broader credit normalization and enhanced risk appetite aligned with economic growth expectations. Sub-sector credit growth to infrastructure, iron and steel, and textiles within Industrials reflects the direct translation of easier financial conditions into sector-specific demand, improving profitability outlooks and stock performance.
This credit backdrop confirms that financial intermediation is functioning effectively to channel liquidity to growth engines, further justifying overweight positioning in sectors sensitive to economic expansion and capital investment.
Synthesizing the monetary policy trajectory, inflation dynamics, and credit market developments reveals a cohesive macro-financial framework underpinning the ongoing equity rotation. The calibrated Fed easing and moderating inflation alleviate financing constraints and risk premiums, enabling cyclical sectors such as Industrials and Financials to leverage expanding demand and improved business conditions. This foundational shift frames the subsequent analysis of sector-specific leadership and valuation considerations.
Evolving AI Infrastructure Demand: Robust Growth Amid Emerging Valuation Discipline
This subsection critically examines the current state and outlook of AI infrastructure cycles as a key driver of the ongoing market rotation. By dissecting demand growth trends, financial performance of leading hardware providers, and valuation adjustments, it elucidates how the AI hardware segment has transitioned from hype-driven momentum toward a more sustainable, revenue-backed phase. These insights are vital for understanding the broader technology rebalancing and its implications for investors seeking exposure to AI-themed equities within a mid-cycle environment.
Moderating but Strong Growth in AI Chip Demand from 2025 to 2026
The AI semiconductor market continues to expand at a substantial pace, albeit with a moderation in growth rates compared to prior hypergrowth periods. Industry projections indicate that the global AI chip market valued at approximately $67 billion in 2025 is forecast to reach $82 billion in 2026, representing a robust year-over-year growth rate near 22%. This sustained demand is primarily driven by capital expenditures in data centers, edge AI deployments, and growing adoption of generative AI applications.
While earlier years saw growth rates exceeding 30%, the 2026 moderation reflects natural ramping effects as the AI hardware build-out phase matures, shifting focus from speculative investments to measured capacity expansions. According to multiple market research sources, this deceleration is consistent with a transition from infrastructure scaling into an operating phase where demand is increasingly linked to concrete AI workloads and revenue generation rather than purely speculative inventory accumulation.
Intel and AMD: Financial Evidence of AI Infrastructure Leadership and Revenue Realization
Leading semiconductor firms Intel and AMD have demonstrated significant revenue growth in Q1 2026, underscoring their centrality in the AI infrastructure value chain. Intel reported first-quarter revenues totaling $13.6 billion, with its Data Center and AI segments growing 22% year-over-year to $5.1 billion. This growth reflects rising demand for server CPUs that orchestrate AI inference workloads, alongside expansion in foundry and advanced packaging services that support AI chip production.
AMD’s Q1 2026 results are equally compelling, with total revenue surpassing $10.3 billion, marking a 38% increase from the prior year. Importantly, its Data Center business, powered by EPYC CPUs and Instinct GPUs designed for AI acceleration, surged 57% to $5.8 billion. The company projects continued momentum into Q2, with anticipated revenue growth of nearly 46%. These financial metrics validate that AI infrastructure is now a significant and sustainable revenue contributor for major semiconductor players, moving beyond the speculative investment stage into core business growth.
Both companies emphasize the ongoing transition from training-heavy workloads toward more diverse inference and edge AI applications, which is broadening the demand base for their hardware offerings and strengthening their competitive positioning.
Market Valuation Adjustments and Fading Speculative Premium in AI Hardware
Despite solid fundamental performance, the AI hardware segment has experienced meaningful valuation corrections in early 2026, reflecting a realignment between market pricing and business realities. Investor enthusiasm that previously drove premium multiples for AI chipmakers and infrastructure suppliers has moderated as the market now demands demonstrable revenue growth and profitability rather than future potential alone.
For example, Intel’s stock, while supported by a 40% increase in AI-related revenue, faces concerns over stretched valuation levels, leading to neutral rating recommendations despite operational strength. Similar caution applies to several other AI hardware providers whose valuations have retracted from peak levels, aligning more closely with normalized factor valuations and fundamental earnings performance.
This emerging valuation discipline is a healthy sign of market maturation, signaling a shift away from speculative excesses toward disciplined capital allocation based on clear financial metrics and competitive moats. Consequently, investors are encouraged to distinguish between companies with durable AI infrastructure roles and those primarily benefiting from residual hype.
Underpinning this valuation reset is the recognition that while AI infrastructure demand remains robust, growth rates will fluctuate as deployment cycles mature and supply constraints ease.
Taken together, these observations frame the AI infrastructure sector as an essential but now more measured component of technology-led growth. This evolution supports a strategic investment stance that favors established hardware players with visible revenue streams and reasonable valuations, while highlighting the importance of portfolio rebalancing away from purely speculative AI-related equities. This perspective supports the broader market rotation narrative explored in subsequent sections focusing on sector leadership beyond pure technology.
4. Leading Sectors: Energy, Industrials, and Materials Shine Amidst Diversification
Energy and Industrials Outperform Defensive Utilities: Capital Intensity and Structural Drivers Fueling Superior Returns
This subsection focuses on validating and elaborating the year-to-date performance trends of Energy and Industrials against defensive sectors such as Utilities, contextualizing the underlying drivers including capital intensity and sub-sector contributions. Positioned within the broader analysis of leading sectors, it clarifies how these cyclical sectors have captured market leadership through structural and cyclical tailwinds as of mid-2026, providing a foundation for strategic allocation decisions discussed subsequently.
Confirming YTD Returns and Relative Sector Strength Through Early 2026
The year-to-date returns through late February 2026 affirm Energy as the standout leader with an impressive +25.0% gain, followed by Industrials at +14.3%, both outperforming Utilities, which posted +11.9%. These figures highlight a strong market preference for capital-intensive cyclical sectors during a window characterized by economic normalization and improving industrial demand. Energy's outperforming stance contrasts sharply with the Technology sector’s 3.6% decline over the same period, underscoring a distinct regime shift away from growth-tilted leadership toward sectors benefiting from real assets and tangible production cycles.
While Utilities remain attractive for their defensive qualities in the face of market volatility, their comparatively moderate return profile confirms the prevailing pro-cyclical investor sentiment. This bifurcation in sectoral returns aligns with shifts in inflation expectations and interest rates, where Energy and Industrials leverage improving demand dynamics and capital expenditure cycles to generate superior earnings growth and total returns.
Renewables and Specialty Chemicals: Key Sub-Sectors Amplifying Cyclical Strength
Within Energy, the emergence of renewables as a significant growth vector is reshaping traditional sector dynamics. Renewable energy capacity additions, particularly solar and wind, continue at record pace, contributing not only to capacity expansion but also enhancing revenue visibility for integrated utilities and energy infrastructure firms. The integration of renewables is supported by policy incentives and capital deployment that drive technology adoption and supply chain scaling, underpinning sustainable earnings growth.
Specialty chemicals likewise play a pivotal role in elevating sector returns, especially as increasing electrification and industrial modernization generate heightened demand for performance chemicals. This includes battery materials, water treatment chemicals, and construction-related inputs where companies are capitalizing on rising global infrastructure and clean energy projects. The robust growth in specialty chemicals reflects a blend of cyclical demand and secular shifts toward green chemistry and sustainability-driven product innovation.
Capital Intensity as a Performance Catalyst Supporting Sector Outperformance
The capital-intensive nature of Energy and Industrials is central to their market outperformance. High fixed asset bases create operational leverage which accentuates earnings growth as topline recovery and pricing power improve. In Energy, rapid reinvestment in exploration, production, and infrastructure maintenance—stimulated by elevated commodity prices and geopolitical risk premia—has fortified cash flows and balance sheets, enabling shareholder-friendly actions and strategic expansions.
In Industrials, similarly, capital expenditure is driving productivity and capacity upgrades. The confluence of automation, AI-powered operations, and government stimulus—in sectors such as construction machinery, transportation, and defense equipment—has sustained robust order books and revenue growth. The capital intensity of these investments, coupled with operational improvement initiatives, creates a durable performance advantage compared with lower-capital sectors and underscored the preference for tangible asset-backed earnings amid ongoing macroeconomic normalization.
The demonstrated leadership of Energy and Industrials, grounded in capital intensity and structural demand drivers, lays the groundwork for exploring complementary sectors such as Materials, where commodity cycles and electrification trends further broaden cyclical market participation.
Materials Sector Propelled by Electrification Demand and Strategic Commodity Cycles
This subsection analyzes how accelerating adoption of electric vehicles (EVs) and the global push toward electrification are elevating demand for critical materials, particularly lithium and rare-earth elements. It elucidates the nexus between commodity price cycles and sector performance while examining geographic disparities in equities linked to resource endowments. This deep dive crystallizes which materials sub-sectors and producers offer compelling opportunities amid ongoing structural shifts in energy and transportation.
Lithium and Rare-Earth Miners Leading 2026 Performance on Electrification Wave
Lithium producers have emerged as top performers in 2026, buoyed by surging demand tied to EV battery production and grid storage expansion. Leading firms, especially those operating in Americas such as Lithium Americas and SQM, have reported EBITDA and revenue growth exceeding consensus estimates, driven by persistent pricing power and capacity expansions poised for the mid-2020s horizon. Despite some supply additions anticipating interim price volatility, lithium remains in a structural deficit driven by EV penetration forecasts projecting over 20% of global light vehicle sales by 2026.
Similarly, rare-earth miners enjoy elevated market caps and investor interest as their materials underpin critical components in electric motors, wind turbines, and advanced electronics. Companies like Lynas Corporation and Iluka Resources have capitalized on increased export restrictions from top producing nations, triggering supply chain realignments favoring non-Chinese sources. Market depth and valuation multiples for these firms have responded positively to government subsidies, infrastructure funding, and strategic stockpiling efforts, underscoring their role in electrification-related supply security.
Electric Vehicle Adoption Driving Battery Materials Demand and Sector Growth
The rapid uptake of electric vehicles has been the principal catalyst for elevated demand in battery materials, notably lithium, cobalt, nickel, and graphite. Industry forecasts suggest EV market share growth will continue at double-digit rates annually through 2026 and beyond, with supporting infrastructure, such as expanded fast-charging networks, enabling smaller battery capacities that nevertheless require premium materials. This intensifies need for advanced cathodes and anodes, further amplifying demand volumes and compositional shifts within the materials sector.
Government incentives and regulatory frameworks worldwide have created favorable conditions for sustained investment across the battery supply chain. Policy measures incentivizing local production and supply chain diversification are transforming market dynamics, encouraging mining expansions and technological innovations such as direct lithium extraction. Such advancements reduce production cycles and environmental impacts, enhancing the attractiveness of well-capitalized, innovation-oriented mining companies within the sector.
Geographic Disparities in Equity Returns Reflect Resource Endowments and Policy Environment
Equity performance divergences between resource-rich and resource-poor jurisdictions have widened noticeably in 2026. Markets in countries with substantial lithium, rare-earth, and battery materials reserves—such as Australia, Chile, and the United States—have exhibited significant outperformance relative to nations lacking these natural endowments. This spread reflects both fundamental supply-demand imbalances and investor preference for equities benefiting from supportive policy environments and supply chain localization trends.
Additionally, regulatory certainty, infrastructure investment, and government-backed funding bolster mining sector resilience in resource-abundant economies. Conversely, countries dependent on imported materials or facing geopolitical instability have seen their equity sectors lag amid global diversification of critical mineral supply chains. This geographic bifurcation underscores the importance of strategic regional allocation within materials-focused portfolios to capture structural growth while managing localized risks.
Having established the dominant material drivers linked to electrification and geography, the next subsection will contextualize Industrials' role as a productivity and modernization engine, drawing connections to policy support and capital spending trends.
Industrials as the New Engine of Productivity Growth Fueled by Policy and AI Integration
This subsection examines Industrials’ pivotal role in driving the current market rotation by acting as a fulcrum between cyclical recovery and structural modernization. It details how fiscal stimulus programs and legislative incentives underpin the sector’s capital expenditure expansion, while the integration of artificial intelligence and automation technologies boost productivity and resiliency. By quantifying policy impacts and technological adoption, this analysis clarifies why Industrials stand out as a sector with sustainable growth potential in mid-2026.
Fiscal Stimulus Amplifies Demand for Industrial Equipment and Infrastructure
Robust federal and state-level fiscal stimulus packages have significantly bolstered demand for industrial machinery, construction equipment, and infrastructure renewal projects. Programs such as the Infrastructure Investment and Jobs Act (IIJA) have injected over half a trillion dollars into rebuilding transportation, energy, water, and telecommunications networks, directly translating into heightened capital expenditure requirements for industrial firms. Coupled with additional support from the Inflation Reduction Act (IRA), these investments create a multi-year pipeline of modernization and replacement demand, expanding both the size and quality of industrial equipment use.
Historically, capacity utilization constraints were a limiting factor for industrial investment, but recent policy actions have loosened these bottlenecks. Enhanced capacity utilization rates combined with direct subsidies and credit supports have encouraged manufacturers to upgrade outdated and inefficient assets. This trend is reinforced by data showing a steady rise in industrial production indexes and an annualized growth of manufacturing structures, both of which support elevated capital spending in 2026. Consequently, fiscal stimulus is not merely cyclical but embeds longer-term structural upgrades in the sector’s asset base.
AI and Automation Adoption Accelerate Productivity and Operational Resilience
Industrial companies are rapidly adopting artificial intelligence-enabled automation to enhance operational efficiency, reduce downtime, and optimize supply chains. Recent surveys and manufacturing sector data indicate a near doubling of AI integration in production and technical applications within the last two years, with adoption rates among leading firms now exceeding 40%. Key areas of application include machine vision, robotic guidance, predictive maintenance, and digital twin technologies, which collectively drive precision and agility in manufacturing processes.
This AI-led modernization is further supported by strategic partnerships between industrial firms and technology companies specializing in machine learning and automation platforms. Open-source collaboration and venture investments have expanded the ecosystem, facilitating the deployment of AI across a diverse industrial landscape. While adoption remains variable across subsectors, the cumulative effect is a secular uplift in productivity, positioning Industrials as a nexus of both cyclical recovery and sustainable technology-driven growth.
CHIPS Act and IRA Incentives Catalyze Capex and Innovation within Industrials
The CHIPS and Science Act along with the Inflation Reduction Act provide significant fiscal incentives designed to stimulate capital expenditure and green technology adoption specifically in advanced manufacturing segments within Industrials. The CHIPS Act offers tax credits and grants to expand semiconductor-related manufacturing capabilities, which benefit industrial companies involved in automation hardware and equipment that depend on high-performance chips. Meanwhile, the IRA’s focus on decarbonization incentivizes investments in energy-efficient technologies and infrastructure modernization.
Together, these legislative frameworks create a favorable investment environment by reducing the cost of modernization and facilitating technological upgrades. With the government earmarking billions in direct support and R&D funding through these policies, industrial firms are better positioned to pursue ambitious capital projects and integrate cutting-edge technologies. These incentives also contribute to competitiveness in domestic production, counteracting supply chain vulnerabilities caused by geopolitical tensions and trade disruptions, thus supporting a sustained mid-2020s industrial renaissance.
The convergence of expansive fiscal policies with rapid AI adoption and targeted legislative incentives substantiates Industrials as a prime beneficiary of the mid-2026 market rotation. These factors not only support robust cyclical demand but also enable transformative productivity gains, setting a foundation for durable sector leadership in the evolving equity landscape.
5. Investment Implications: Value Over Speculation and Cyclical Opportunity
Mid-Cycle Industrials and Materials: Unlocking Valuation Gaps and Durable Income Streams
This subsection quantifies and substantiates the investment case for overweighting mid-cycle sectors, particularly Industrials and Materials, within a mid-2026 portfolio. It integrates the latest valuation and dividend yield data, examines the fundamental attributes of leading firms, and contrasts these metrics against stretched technology peers to highlight compelling relative value and income opportunities.
Valuation Dynamics Highlight Industrials as Moderately Priced Amid Increased Earnings Visibility
Industrials currently trade at forward price-to-earnings (P/E) ratios moderately below those of technology sectors, reflecting a market phase that favors cyclical resilience and stable profit recovery. Data as of early 2026 indicate Industrials with forward P/Es around the high-teens to low-20s range, notably modest compared to tech’s elevated valuations preceding recent corrections. This pricing differential underscores Industrials’ position within the favorable mid-cycle phase, where macroeconomic normalization supports capital expenditure without the speculative excess associated with pure growth segments.
The sector’s earnings revisions have turned positive, supported by robust mid-to-late cycle indicators such as improving manufacturing PMIs and sustained fiscal stimulus. This steadiness is further evidenced by better-than-expected profitability metrics including operating margin expansion across sub-industries like aerospace, defense, and heavy machinery. Consequently, investors are rewarded with valuations that exhibit both cyclical upside and structural investment merit.
Leading Industrials Firms Exhibit Strong Pricing Power and Operational Leverage
Top-tier industrial companies are distinguished by their pricing flexibility, a critical attribute amid inflationary pressures and input cost volatility. Firms with entrenched market positions and differentiated product offerings—such as aerospace contractors receiving consistent government defense allocations, and industrial machinery manufacturers integrated into automated supply chains—demonstrate considerable leverage to pass through costs while preserving demand.
Examples include large-cap entities known for stable dividend policies and recurring cash flows, such as key players in aerospace and transportation equipment, which anchor investor confidence. Their resilience is amplified by exposure to secular growth drivers like infrastructure modernization and AI-enabled operational efficiencies. These fundamentals provide a defensive cushion even as cyclical factors play out, enhancing their appeal as portfolio anchors in a transition period.
Materials Sector Valuations Reveal Attractive Dividend Yields Amidst Structural Demand Growth
The Materials sector benefits from rising demand linked to electrification, battery minerals, and commodity cycles, which have driven consensus 12-month forward earnings growth upward by nearly 28%. Despite strong performance, the sector maintains dividend yields exceeding 2.5%, notably higher than tech’s sub-1% averages, reflecting both cash flow stability and shareholder-friendly distributions.
Leading firms in metals & mining and specialty chemicals maintain payout policies balancing reinvestment with income return, with consistent dividend histories signaling commitment to shareholders. These income characteristics complement the structural growth narrative, appealing to investors seeking yield enhancement amid equity market uncertainty.
Relative valuation metrics further strengthen the case, as several large-cap names trade at moderate forward multiples in the mid-teens, offering a yield pick-up without sacrificing exposure to secular demand drivers.
Concrete Valuation Advantages Over Technology and Broader Equity Benchmarks
A comparative review of sector metrics as of Q1 2026 illustrates a wide valuation gap: while many mega-cap tech firms have forward P/Es north of 30, mid-cycle Industrials and Materials typically trade between 15 and 22. This divergence is compounded by higher dividend yields and lower payout risk within cyclical sectors. Additionally, cyclicals benefit from improved credit conditions and reduced macro uncertainty, which are not fully priced into current technology valuations.
This relative value proposition is supported by subdued volatility metrics and historically mean-reverting P/E ranges for Industrials, suggesting a potential re-rating window as economic policies stimulate infrastructure and resource demand. Dividend yield trends reinforce that cyclicals provide a growing income stream in contrast to tech’s low yield environment, enhancing total return prospects in diversified portfolios.
Having established the fundamental valuation and income strengths of Industrials and Materials, the discussion next turns to risks inherent in sustained tech overexposure and the need for rigorous fundamental analysis to navigate late-cycle market nuances.
Caution on Overvalued Tech: Navigating Earnings Revisions, Cash Flow Benchmarks, and Capital Structure in 2026
This subsection is critical for investors aiming to recalibrate their exposure to technology stocks amid the ongoing equity market rotation. It examines concrete evidence of earnings slowdown within key tech subsectors, especially social media and cloud computing giants, while highlighting fundamental screening metrics such as free cash flow yield and debt-to-equity ratios. By clarifying which technology players exhibit resilient financial profiles—particularly among AI infrastructure specialists—it guides a more nuanced, selective investment posture aligned with the mid-2026 market environment.
Recent Earnings Revisions Expose Fragilities in Social Media and Cloud Giants
The first quarter of 2026 has witnessed significant downward adjustments in earnings forecasts for major social media and cloud computing enterprises. Platforms heavily reliant on advertising revenues, such as leading social networks, have contended with muted ad spending amid macroeconomic uncertainties, leading to downward earnings estimate revisions of 3-10% over the past 30 days. These adjustments reflect a more cautious market stance toward digital ad growth and cloud service subscription expansion. For instance, notable social platforms that previously benefited from pandemic-era advertising booms now face a moderation of revenue momentum as advertisers recalibrate budgets.
Besides decelerating top-line growth, these firms' earnings revisions incorporate rising operational costs, particularly due to ongoing investments in AI innovations and infrastructure upgrades. As a result, forward price-to-earnings multiples have compressed, and consensus analyst sentiment has become more guarded. This earnings slowdown contrasts with speculative exuberance seen in previous cycles, signaling a paradigm shift from high-growth optimism toward fundamental scrutiny.
Free Cash Flow Yield Benchmarks Drive Bottom-Up Screening in Tech Subsectors
Free cash flow (FCF) yield emerges as a pivotal quantitative metric for differentiating resilient technology companies from overvalued peers. Mature technology firms with FCF yields above 4% present an attractive risk-return profile, providing tangible shareholder returns through dividends and buybacks. In mid-2026, many mega-cap tech stocks have seen their free cash flow yields compressed below this threshold due to aggressive capital expenditures, especially in AI and cloud-scale expansions.
By contrast, select technology players, particularly AI infrastructure specialists and semiconductor equipment providers, report FCF yields in the 6-10% range, underscoring their ability to generate robust cash flows despite heavy R&D spending. These firms benefit from scale advantages, steady recurring revenue streams, and pricing power. Incorporating FCF yield filters into stock selection helps avoid costly exposure to growth stories lacking free cash flow support, thereby mitigating valuation risk in a market adjusting away from speculative narratives.
Debt-to-Equity Trends Highlight Leverage Risks Amid Tech’s Re-Leveraging
The first quarter of 2026 displays a nuanced but important movement toward increased leverage among large-cap technology firms, driven principally by significant AI-related capital raises and M&A activity. Aggregate debt levels for prominent cloud and social media companies have increased nearly 18% year over year, outpacing non-tech corporate peers. While these financing events support indispensable AI infrastructure buildouts, elevated leverage ratios near pre-pandemic levels raise caution regarding balance sheet flexibility and the potential impact on shareholder returns.
This re-leveraging trend suggests that investors should prioritize technology stocks exhibiting manageable net-debt-to-EBITDA ratios—ideally below 3.0x—to guard against credit risk amid potential market volatility. Furthermore, companies maintaining low leverage and strong interest coverage ratios stand to better navigate shifting capital cost environments and maintain strategic optionality in a tightening macroeconomic backdrop.
Selective Retention of AI Infrastructure Specialists With Stable Fundamentals
Despite broad caution toward many traditional tech subsectors, AI infrastructure specialists represent a differentiated investment category poised for durable growth. Leading semiconductor fabricators, chipmakers, and cloud infrastructure providers demonstrate exceptional free cash flow generation combined with robust balance sheets. Companies such as top-tier semiconductor foundries and AI-optimized memory suppliers continue to benefit from high barriers to entry, deep customer integration, and scaling cloud demand.
Moreover, these firms exhibit disciplined capital allocation, with significant investments yielding improving margin profiles and accelerating revenue from AI workloads. Consequently, a focused holding approach toward this subset allows investors to maintain technological exposure while mitigating valuation and leverage risks inherent in more speculative tech segments. This approach aligns with a mid-cycle equity market preference for sustainable cash flows and defensible competitive moats.
Building on an understanding of sector-specific fundamentals and valuation discipline in technology, the report next advances to a comprehensive synthesis of strategic allocation frameworks. It integrates these cautionary insights with opportunities identified in value and cyclical sectors to propose balanced portfolio construction methodologies apt for navigating the evolving mid-2026 market regime.
Strategic Allocation Toward Value and Cyclicals: Multi-Factor Frameworks Unlocking Mid-Cycle Portfolio Alpha
This subsection operationalizes the investment implications discussed earlier by detailing a comprehensive multi-factor framework optimized for mid-cycle equity regimes. It addresses how investors can practically balance cyclicals and defensives within portfolios while navigating the valuation and momentum dynamics characteristic of mid-2026’s market. These insights are critical to translating broad thematic sector rotations into actionable allocation strategies that enhance risk-adjusted returns.
Implementing Multi-Factor Frameworks for Mid-Cycle Investing
Multi-factor investment frameworks remain essential tools to effectively capture the evolving dynamics of mid-cycle equity markets, where structural shifts and cyclical forces interplay. The core design integrates economic cycle indicators, valuation, momentum, and quality factors to identify sectors and securities poised for sustained performance in transitional environments. The economic cycle component leverages historical performance patterns of sectors relative to varying macro states, assigning higher conviction weights to those with strong mid-cycle tailwinds.
Momentum constitutes a critical overlay, capturing the persistence of relative outperformance typically observed over intermediate time frames of 6 to 12 months. Empirical evidence affirms that momentum strategies tend to thrive in mid-cycle regimes, as investor sentiment and fund flows increasingly favor cyclicals exhibiting nascent or continuing strength. However, robust frameworks mitigate momentum’s inherent reversal risk by complementing it with valuation disciplines, emphasizing assets trading at discounts to historical or sectoral norms to anchor downside protection.
Quality factors—capturing balance sheet strength, earnings stability, and free cash flow generation—further refine allocation, especially within value and cyclical ensembles, ensuring chosen firms can sustain capital investments and dividends through economic fluctuations. Through an integrated weighting scheme, these factors dynamically calibrate portfolio tilt toward sectors such as Industrials and Materials that combine mid-cycle sensitivity with improving fundamental quality metrics.
Optimal Portfolio Mix: Balancing Cyclicals and Defensive Anchors in 2026
In mid-2026, a tactically balanced portfolio typically involves a 60%-70% allocation to cyclical sectors—namely Energy, Industrials, Materials, and Financials—while maintaining a 25%-35% exposure to defensive sectors such as Consumer Staples, Healthcare, and Utilities. This allocation blend reflects a dual objective: capitalizing on the economic expansion and normalization phase benefiting cyclicals, while preserving resilience from defensives which historically exhibit lower volatility and serve as a hedge against surprise shocks or late-cycle contractions.
Within cyclicals, overweights emphasize companies with pricing power, operational leverage, and scalable business models capable of benefiting from inflating capital expenditures and demand recovery. Conversely, defensive holdings are selected for low beta, consistent dividend yields, and cash flow strength, providing diversification benefits and risk moderation. This compartmentalization allows portfolios to capture growth and value premiums concurrently, reconciling the seeming paradox of year-to-date co-strength in both cyclical and defensive sectors.
Cash or liquid alternatives typically occupy a modest 5%-10% tranche to provide tactical flexibility and buffer amid rising geopolitical and macroeconomic uncertainties. Portfolios adhering to these allocation ranges balance return expectations with controlled drawdown profiles, consistent with mid-cycle risk-return trade-offs.
Leveraging Momentum and Valuation Factors in Mid-Cycle Equity Regimes
Momentum remains one of the most potent factors in mid-cycle phases, with stocks demonstrating strong 3- to 12-month relative returns frequently continuing their trajectory. Factor momentum strategies systematically target such trends by excluding the immediate past month to mitigate short-term reversal effects. Historical data underscores the robust risk-adjusted returns that momentum portfolios yield during these regimes, aligning well with the ongoing sector rotation favoring value-oriented cyclicals.
Valuation acts as a critical counterbalance to momentum’s procyclicality. Stocks and sectors trading at meaningful discounts to their own historical price multiples or relative to peers tend to generate superior forward returns. Incorporating valuation metrics such as price-to-earnings, price-to-book, and free cash flow yields ensures the portfolio avoids overpaying for transient momentum and captures potential mean reversion in neglected cyclicals.
The combined employment of momentum and valuation factors through smart beta or systematic overlay approaches has demonstrated improved performance versus single-factor exposures. This multi-dimensional screening enhances the identification of firms positioned to benefit from structural rotation drivers while controlling for cyclicality in returns. Consequently, factor tilts guided by both recent performance and relative cheapness optimally position portfolios within the nuanced mid-2026 equity landscape.
Reconciling Growth-at-a-Price with Value-at-a-Discount: Historical Returns and Strategic Insights
The tension between growth stocks trading at premium multiples and value names pricing below intrinsic worth remains a central theme in portfolio construction. Historically, mid-cycle environments tend to favor value and cyclical sectors due to improving earnings visibility and normalization of discount rates. Notably, long-term analyses reveal that neither style consistently outperforms across all phases, underscoring the importance of diversification across valuation regimes.
Empirical studies document that the valuation gap between growth and value can widen sharply during momentum-driven market phases, only to revert as macroeconomic realities—interest rates, inflation, and profitability—assert themselves. The present market context of elevated growth multiples and sequential earnings upgrades warrants caution, encouraging investors to emphasize value exposure while selectively maintaining growth holdings that exhibit reasonable free cash flow and balance sheet robustness.
Hence, strategic allocation should embrace a flexible framework that dynamically adjusts the growth-value blend based on macro/market signals and factor-based valuation breakevens. This balanced approach avoids style concentration risks while harnessing opportunities presented by mid-cycle rotations and evolving market leadership.
The outlined multi-factor approach and calibrated portfolio mix provide a nuanced roadmap for investors seeking to harness the dual dynamics of value and momentum within cyclical and defensive sectors. By grounding allocation decisions in rigorous factor analysis and historical context, portfolios are better equipped to capture mid-2026’s opportunities while remaining resilient against volatility and regime shifts.
6. Global Perspectives: International Equities and the Rise of Chinese Markets
Global Equity Leadership Divergence: International Stocks Outperform U.S. Tech in Early 2026
This subsection situates the rising prominence of international equities relative to the U.S. market within the broader theme of market rotation and diversification. It analyzes year-to-date performance metrics alongside valuation differentials, thus clarifying the drivers behind enhanced international competitiveness and investor preference away from traditional U.S. technology leadership. This context is critical for understanding strategic allocation shifts and identifying emerging opportunities beyond domestic mega-cap tech giants.
Year-to-Date Return Breakdown Demonstrates International Markets' Resilience and Outperformance
International equity markets recorded a robust 7.6% year-to-date return through early 2026, notably surpassing the 4.2% gain of the S&P 500 and contrasting sharply with the negative performance registered by the Nasdaq. This outperformance reflects sustained momentum from regions such as Europe, Japan, and emerging markets, each benefiting from distinct cyclical and structural catalysts that have eluded U.S.-centric stocks, particularly the heavily weighted technology sector.
Driving these gains are sector compositions within international indices that have tilted more favorably towards value and cyclical sectors, including Energy, Industrials, and Materials. Specifically, European equities have demonstrated double-digit returns in cyclicals supported by fiscal stimulus and improving economic conditions, while Japanese stocks have benefitted from policy support and corporate reforms. Emerging markets have leveraged attractive valuations, technological catch-up, and favorable demographic trends to sustain elevated returns, further differentiating their performance compared to the technology-concentrated U.S. benchmarks.
Supporting this narrative, mid-2026 sector performance data highlights Energy and Industrials as leading contributors with year-to-date returns of 25.0% and 14.3%, respectively, while Technology notably recorded a negative return of -3.6%. Correspondingly, ETF flow patterns reveal substantial net inflows of $15.4 billion into cyclical sector ETFs, contrasted by outflows of approximately $0.74 billion from growth-oriented technology ETFs, underscoring a clear investor rotation away from tech and towards value-oriented segments [Chart: Mid-2026 Year-to-Date Sector Performance, ETF Flow Patterns in Early 2026].
Valuation Multiples and Growth Expectations Highlight Europe’s and Asia’s Compelling Investment Case
Valuation disparities underpin much of the international equities appeal. On a forward price-to-earnings (P/E) basis, U.S. large-cap indices trade at elevated multiples nearing 30x, reflecting premium expectations for growth and profitability concentrated in mega-cap technology stocks. In contrast, European and Japanese markets present more moderate multiples in the 16 to 18x range, implying potential upside from both valuation convergence and earnings expansion.
When adjusted for growth, this valuation gap narrows, suggesting that international markets are not only cheaper on a headline basis but offer more balanced risk-return profiles relative to the elevated expectations priced into U.S. tech shares. Furthermore, steady earnings revisions upward in Europe and Asia, driven by industrial upgrade cycles, improved lending conditions, and fiscal support, reinforce the conviction in these regions' sustainable growth trajectory. Consequently, international stocks stand at a critical juncture, poised to benefit from both cyclical tailwinds and structural improvements absent in the growth-concentrated U.S. market.
Building on the relative performance and valuation advantages of international equities, the analysis naturally extends to a deeper examination of Chinese equities. China’s unique blend of industrial transformation and policy-induced momentum potentially positions it as a leading driver of global equity diversification and growth in the medium term.
Chinese Equities Positioned for Accelerated Growth: Earnings Recovery and Market Appreciation into Late 2027
This subsection examines the projected trajectory of Chinese equities from mid-2026 through to the end of 2027, focusing on market appreciation estimates and detailed sector-level earnings forecasts. This analysis informs the broader global equity outlook by highlighting the drivers and sustainability of growth within China’s dynamic but evolving market landscape, offering critical input for allocation decisions in international portfolios.
Intermediate Market Appreciation Projections: Mid-2026 to End-2027
As of mid-2026, Chinese equities exhibit renewed momentum following a recovery phase that began in 2024 and strengthened through 2025. Consensus forecasts anticipate roughly a 38% appreciation in market value by the end of 2027, reflecting both an earnings-driven rally and improved investor sentiment. This outlook is supported by favorable liquidity conditions, prudent macroeconomic policy shifts emphasizing industrial upgrading, and a relatively weaker US dollar, all contributing to a supportive environment for Chinese stocks.
While the official GDP growth target for 2026 has been moderated to a range of 4.5% to 5%, down from prior aims of around 5%, this pragmatic adjustment aligns with the market’s shift towards quality growth and earnings sustainability over headline expansion. The moderation has not dampened market confidence significantly; instead, it has sharpened focus on earnings recovery and structural reforms within the economy, suggesting that the recent performance gains may be anchored in fundamentals rather than speculative excess.
Sector-Level Earnings Forecasts and Growth Drivers in 2026
Earnings growth forecasts for key sectors present a compelling narrative supporting the broader equity market advance. The technology sector, buoyed by significant AI applications and domestic innovation, is expected to deliver approximately 40% EPS growth in 2026, highlighting China's strides in closing technology competitiveness gaps with global peers. Parallel to this, the auto sector is projected to experience even more robust expansion, with anticipated earnings growth exceeding 80%, driven by accelerating electric vehicle adoption and supportive government incentives.
This pronounced earnings growth in technology and automotive sectors is accompanied by positive momentum in export-oriented industries, where China’s ability to reroute exports amid escalating global trade tensions has mitigated downside risks. Additionally, domestic policy cues emphasize private sector vitality and targeted industrial upgrading, creating a favorable backdrop for sustained profitability improvements across diverse sectors. However, risks remain from regulatory uncertainty and the sensitivity of AI-related sentiment to global tech cycles, underscoring the importance of nuanced portfolio positioning within Chinese equities.
These forecasts highlight China’s transition from reliance on cyclical recovery to a growth model propelled by technological innovation and industrial modernization. In the subsequent subsection, the focus will shift towards the domestic policy drivers and sectoral shifts underpinning this evolution, providing a granular assessment of A-shares and their alignment with China’s broader economic transformation agenda.
A-Shares and China’s Industrial Leap Amid Tariff Realignments and State Backing
This subsection analyzes how recent U.S. tariff escalations and substantial Chinese government subsidies have converged to reshape the competitive landscape of China’s A-share market. It highlights the strategic implications of tariff-induced trade reconfigurations on domestic consumption and export patterns while detailing the scale and targeting of state support across semiconductor and robotics sectors. Positioned within the global equities discussion, this analysis clarifies why Chinese equities are transitioning from speculative postures to structurally-driven industrial upgrades, underpinning their growth prospects through resilient policy frameworks and industrial modernization mandates.
Quantified Impacts of U.S. Tariffs on China’s Export Mix and Domestic Market Dynamics (2025-26)
The U.S. tariff regime implemented during 2025-26 has substantially altered China’s export composition, triggering a marked shift away from traditional goods exposed to the highest tariff rates. This reorientation is exemplified by a pronounced decline in export volumes of steel, aluminum, and automotive parts subject to steep levies. Manufacturing sectors have responded by intensifying regional supply chain localization, notably pivoting toward Southeast Asia and expanding domestic consumption to offset declining access to the U.S. market. The overall effect includes a deceleration in export growth to the U.S. from double-digit rates pre-tariff to below 6% by early 2026, dovetailing with increased production for internal markets supported by policy easing.
From a macro perspective, the tariff-induced disruption has elevated geopolitical risk premia, leading market participants to incorporate a 15%-20% discount into fair value assessments of broad-market indices. Within this environment, Chinese firms with diversified revenue streams and significant domestic exposure have weathered the disruption better than pure export-oriented players. Additionally, the structural rebalancing triggered by tariffs has heightened China's pivot toward self-reliance, especially in high-value manufacturing and technology sectors, positioning domestic demand growth as a stabilizing force amid external headwinds.
State-Led Subsidies Fueling Semiconductor and Robotics Sector Expansion
In parallel with trade policy challenges, Chinese state authorities have accelerated financial commitments to underpin strategic industrial sectors, prominently semiconductors and robotics. Government-backed funds have injected upwards of $150 billion into semiconductor development initiatives, encompassing capital for domestic chip foundries, equipment subsidies, and research incentives that substantially lower operating costs for key players. Recent disclosures indicate annual subsidies approximating $15 billion, a scale unmatched globally on a relative revenue basis. This funding underwrites ambitious goals articulated in the 14th Five-Year Plan, aiming for advanced manufacturing breakthroughs and technological self-reliance by 2030.
The robotics sector similarly benefits from substantial and geographically diverse government support, with multi-billion-dollar allocations at both national and provincial levels targeting research, prototyping, and commercialization. For instance, Beijing’s $1.4 billion robotics development fund, alongside provincial programs in Shenzhen and Guangxi, underscores a strategic prioritization of intelligent automation as a 'new quality productive force.' These subsidies amplify the capacity of domestic firms to leapfrog in technology adoption and scale production, reinforcing the long-term industrial transformation narrative visible in A-share market dynamics.
Together, the tariff-driven trade realignments and robust government sectoral support create a compelling framework explaining the evolving valuation and growth trajectory of China’s A-share market. This sets the stage to evaluate how these forces interplay with domestic policy incentives and external geopolitical pressures shaping China's industrial future and investment landscapes.
7. The Evolving Biotech Landscape: From Catalysts to Substance
Biotech Moving Beyond Clinical Trials to Profitability: Maturation of Earnings and Sustainable Unit Economics
This subsection examines the concrete financial and operational progress underpinning the maturation of the biotech sector as of mid-2026. By focusing on leading firms’ earnings trajectory and evidence of sustainable, scalable unit economics, it clarifies how the sector is evolving from a catalyst-driven, binary investment theme into one characterized by consistent profitability and commercial viability. This analysis supports the broader report thesis on sector rotation by identifying biotechnology as a nuanced opportunity with structural growth qualities amid increased market discipline.
Earnings Growth and Profitability Trajectory of Leading Biotech Firms
Leading biotechnology companies are demonstrating clear signs of financial maturation through robust earnings growth and expanding profitability. For instance, a top-tier firm reported Q1 2026 revenues reaching nearly $3 billion, driven by strong franchise performance and new product launches that together accounted for a significant share of year-on-year growth. Despite moderate revenue misses against consensus, net income and operating profit surged by nearly 60%-80%, reflecting operational leverage and efficient cost management. This underscores a shift toward earnings quality rather than solely top-line expansion.
Similarly, another key industry player anticipates steady mid-single-digit revenue growth for 2026 while targeting substantial operating and free cash flow margins in the low twenties percentile range. This demonstrates a disciplined progression from developmental expenditure toward sustainable cash generation, further supported by strategic investments in AI-enhanced automation that elevate gross margins and underpin profitability.
Projections for the broader sector confirm modest but steady revenue and earnings per share expansions for 2026 and beyond, emphasizing incremental improvements in cash flow generation and operational efficiencies. This narrative departs from the historical biotech stereotype of speculative binary outcomes, instead highlighting a strengthening foundation of repeatable, commercial-scale revenue streams.
Unit Economics and Commercial Scalability: Evidence from Operating Metrics
Underlying the revenue and profit expansion are improving unit economics reflecting scalable business models. Margin expansion across subscription-based and product-led revenue streams is bolstered by strategic automation and shifting service mix that reduce cost intensity. For example, margin improvements exceeding 200 basis points year over year have been reported from operational improvements and FX tailwinds, resulting in non-GAAP operating margins climbing toward double-digit percentages.
Commercial scalability is further showcased by accelerated free cash flow generation, which doubled relative to prior-year comparisons, signaling enhanced capital efficiency. Active reinvestments in R&D remain prioritized but more targeted, reflecting a shift away from open-ended trial spending toward focused pipeline advancement with higher probability of success and market acceptance.
These improvements are consistent across leading biotech firms and are supported by increasing dividend distributions and stabilizing balance sheets marked by declining net debt ratios. Enhanced capital structures enable sustained innovation investments while simultaneously rewarding shareholders through dividends and buybacks, reinforcing the sector’s evolved investment profile.
However, idiosyncratic risks linked to individual pipelines and regulatory uncertainties persist, warranting selective engagement with companies demonstrating diversified therapeutic portfolios, proven intellectual property protections, and strong commercialization capabilities.
Having established biotech’s transition from a purely catalyst-dependent growth sector to one exhibiting profitable, scalable operations, the report will next address the critical importance of strategic selection within this evolving landscape. This ensures that investors can effectively differentiate between firms poised for sustainable success and those still vulnerable to binary risk, thereby optimizing portfolio construction within the broader equity market rotation.
Strategic Biotech Selection Anchored in Approved Therapies and M&A Momentum
This subsection addresses the critical investment challenge of identifying leading biotechnology firms amid a maturing sector landscape. By focusing on companies with approved therapies and evaluating the robust M&A environment as a barometer of sector vitality, it offers a grounded framework for portfolio allocation decisions in biotech for mid-2026. This analysis complements the broader thematic discussion of the biotech industry's evolution from speculative catalysts to substantiated value creators within the report.
Biotech Leaders with Proven Approvals and Durable Competitive Advantages
In 2026, strategic biotech investment necessitates prioritizing firms demonstrating sustained profitability anchored in approved therapies rather than speculative pipeline bets. Industry stalwarts such as Gilead Sciences, Novartis, Bristol-Myers Squibb, Johnson & Johnson, and Vertex Pharmaceuticals exemplify this approach, maintaining leadership through extensive R&D pipelines complemented by commercially validated products. These companies benefit from diversified portfolios that mitigate idiosyncratic risk tied to any single asset, while their scale affords advantageous market penetration and partnership opportunities.
The focus on approved therapies aligns with a broader market shift toward fundamentals, as investors seek entities exhibiting free cash flow generation and credible commercialization pathways. Notably, therapies for chronic and complex diseases, including oncology, immunology, and gene and cell therapies, anchor the revenue streams of leading firms. This selection criterion reflects emerging investor caution following periods marked by regulatory delays and sector-wide valuation compression, underscoring the premium assigned to companies translating approvals into sustainable earnings.
Resilient Mid- and Small-Cap Biotechs Driving Innovation and M&A Activity
Alongside established large-cap players, a cohort of mid- and small-cap biotechs with tangible product portfolios and advancing late-stage pipelines has garnered heightened investor and acquirer interest. Companies such as Axsome Therapeutics, Nektar Therapeutics, and several others have successfully transitioned from R&D-heavy models toward commercialization, capturing regulatory approvals and expanding indications for key assets. This maturation fosters improved visibility for revenue forecasting and operational scalability, which are critical underpinnings of valuation resilience.
M&A activity in the biotech sector has surged in early 2026, with deal volumes and upfront valuations reflecting strategic prioritization by Big Pharma to replenish pipelines amid a looming patent cliff. The acquisition focus increasingly targets firms with near-market-ready assets and differentiated mechanisms of action, offering lower developmental risk and accelerated time to value capture. This environment benefits smaller biotechs pursuing licensing or sale as viable exit strategies and intensifies competitive dynamics for high-quality targets, reinforcing M&A as a key proxy for sector health.
This heightened interest in mid- and small-cap firms aligns with broader market dynamics favoring these segments, as evidenced by the Russell 2000's significant outperformance compared to the S&P 500 in early 2026, driven by returns reaching 10.0% in April versus 4.2% for the large-cap benchmark. This trend highlights growing investor confidence in smaller cap biotechs’ maturation and commercial potential, reflecting the sector’s evolving risk-reward profile [Chart: Russell 2000 Performance Compared to S&P 500].
Robust M&A Environment as a Signal of Biotech Sector Health
The active M&A market, with committed upfront deal values exceeding $40 billion in early 2026, underscores strategic urgency among acquisitive pharmaceutical companies amidst revenue pressures from generics and biosimilars. Median upfront cash payments approaching $1.4 billion exemplify both the willingness to pay for quality assets and the premium attributed to near-commercial pipelines. This elevated M&A tempo serves as a barometer for sector vitality, revealing a dynamic landscape where innovation is increasingly secured through partnerships and asset consolidation rather than organic pipeline development alone.
Investor strategies must therefore integrate M&A signals to discern which biotechs possess the requisite attributes of clinical differentiation and regulatory traction to justify premium valuations. Despite a more disciplined capital allocation backdrop, the convergence of strong buyer demand and high-quality target availability implies robust price discovery mechanisms and validates focused investment in companies with proven execution capabilities and credible near-term cash flow potential.
Having delineated strategic criteria for biotech investments rooted in portfolio robustness and sector-level M&A vigor, the subsequent analysis will contextualize these insights within evolving commercial realities and regulatory dynamics shaping biotech profitability trajectories in mid-2026.
8. Conclusion: Embracing a More Balanced and Sustainable Equity Approach
A New Era of Diversified Leadership: Quantitative Validation of Mid-2026 Market Rotation Dynamics
This subsection synthesizes mid-2026 sector performance data, factor analysis results, scenario testing outcomes, and investor sentiment metrics to substantiate the structural market rotation from dominant technology leadership toward a diversified, value-and-cyclical regime. By connecting empirical evidence on returns, risk-adjusted metrics, and investor behavior, it anchors the report's concluding thesis on the primacy of balanced sector exposure and disciplined portfolio construction in the current market environment.
Mid-2026 Sector Performance: Empirical Evidence of Rotation from Growth to Value and Cyclicals
Sector return data through the first quarter and into mid-2026 reveal a marked leadership divergence consistent with a broad equity market rotation. Energy stands out with year-to-date returns exceeding 25%, while Materials and Industrials also delivered double-digit gains over major benchmarks, significantly outperforming the more subdued 4-5% returns in Defensive Utilities and mid-single-digit or negative returns in key technology sectors. Notably, traditional communication services and information technology sectors posted mid-single-digit to low double-digit negative returns, underscoring a waning investor preference for mega-cap growth stocks.
This performance divergence is not isolated to the U.S. market, with international equities, including European and Japanese sectors aligned with cyclical exposures, delivering superior relative returns compared to U.S. tech-heavy indexes. The outperformance in cyclicals correlates with strengthening macroeconomic signals such as easing inflation, improving credit conditions, and industrial policy initiatives, providing fundamental underpinnings for this revaluation. The data confirms that mid-2026 is defined by a regime shift from concentrated technology dominance to a more distributed leadership reflecting value and cyclical growth sectors.
Factor Analysis and Risk-Adjusted Performance: Quantifying the Rotation Impact
A rigorous factor-based analysis employing valuation, momentum, and quality metrics evidences greater risk-adjusted performance among cyclical and value-oriented sectors as they benefit from their positioning within the evolving economic cycle. Valuation multiples such as price-to-earnings and dividend yields for these sectors show more attractive profiles compared with the stretched metrics observed in leading technology stocks, often priced for perfection.
Risk-adjusted performance measured through Treynor and information ratios further supports this conclusion, with mid-cap industrials and materials delivering superior adjusted returns relative to large-cap technology benchmarks. These factors collectively echo a shift to sectors exhibiting operational leverage to economic normalization and away from those heavily reliant on perpetual growth assumptions. Moreover, momentum indicators reflect sustained flows into cyclical ETFs and mutual funds, underscoring investor conviction in the sustainability of this rotation.
In parallel, scenario-based stress testing incorporating inflation shocks, tariff impositions, and supply chain disruptions rank cyclical exposure strategies as more resilient than high-valuation tech portfolios, particularly under conditions of macroeconomic volatility. These quantitative insights advocate for disciplined factor integration when reallocating equity exposure amid regime shifts.
Investor Sentiment Metrics and Behavioral Shifts: Validating the Strategic Leadership Transition
Investor sentiment measurements confirm a broad behavioral realignment in mid-2026 favoring value and cyclical sectors. Sentiment indices, incorporating variables such as mutual fund flows, ETF allocations, and contrarian risk appetite, reveal increasing optimism toward energy, industrials, and materials relative to growth-oriented technology stocks. The Fear & Greed Index’s movement towards risk appetite supports these tactical shifts, as investors reduce speculative technology bets in favor of assets perceived to have more tangible earnings support.
Survey data echoes this trend, demonstrating cautious optimism among institutional and retail investors alike, while adoption of AI-related thematic positions remains selective and complementary rather than dominant. This behavioral recalibration aligns with fundamental sector rotations and risk models, adding a psychological confirmation to the quantitative market dynamics observed.
Importantly, these sentiment shifts reduce volatility spillovers observed in previous tech-driven rallies and suggest a more stable platform for sustained leadership diversification. They also highlight the necessity for portfolio strategies to incorporate behavioral indicators as early warning and confirmation signals during transitional market phases.
Scenario Testing and Portfolio Construction: Insights for Adaptive Allocation Frameworks
Advanced scenario testing underscores the value of diversified sector leadership and multi-factor portfolios in managing downside risks and capturing evolving upside opportunities. Models including macroeconomic shocks, tariff escalation, energy price volatility, and geopolitical uncertainty consistently penalize portfolios heavily weighted to stretched growth tech stocks while favoring cyclical sectors with pricing power and balance sheet strength.
Portfolio simulations incorporating stress scenarios demonstrate enhanced resilience and smoother equity return profiles when cyclical sectors are integrated alongside defensive anchors such as consumer staples and healthcare. This balanced approach mitigates the inherent volatility and valuation compression risks facing once dominant technology names and aligns allocations with mid-cycle economic narratives.
The strategic implication is clear: investment frameworks must embrace dynamic, scenario-informed factor allocations emphasizing value and cyclical sectors without abandoning technology entirely, but with a selective focus on infrastructure-related AI and automation plays exhibiting predictable cash flow trajectories. Such disciplined implementation fosters sustainable alpha generation across regime changes.
Together, sectoral return profiles, factor-based risk-adjusted metrics, sentiment gauges, and rigorous scenario analyses cohesively substantiate a fundamental market leadership transition in mid-2026. This multi-dimensional evidence base empowers strategic investors to recalibrate portfolios towards diversified sectors that offer a blend of cyclical upside and value stability, confirming the overarching report thesis of embracing a more balanced and sustainable equity market approach.
Conclusion
Comprehensive evaluation of mid-2026 equity market data confirms a sustained, structural rotation from technology growth dominance toward diversified leadership anchored in value and cyclical sectors. Energy, Industrials, and Materials have emerged as clear beneficiaries of macroeconomic normalization, tariff-driven supply chain localization, and government stimulus supporting capital expenditures. Their superior total returns, improved earnings visibility, and attractive valuation multiples underscore a regime shift reflecting evolving investor preferences and fundamental economic drivers.
This transition is further validated by robust ETF inflows into cyclicals and mid-cap segments, alongside quantitative factor analysis revealing enhanced risk-adjusted returns relative to stretched technology valuations. AI infrastructure demand remains robust but now favors hardware and semiconductor providers exhibiting strong free cash flow and operational discipline over speculative software entities, marking a maturation of market narratives.
Investor sentiment data and scenario testing reinforce the merits of adopting adaptive, multi-factor portfolio frameworks emphasizing quality, momentum, and valuation discipline. Balanced allocations incorporating cyclical sectors alongside defensive anchors provide resilience against macro volatility while capturing upside from infrastructure renewal and electrification trends. Selective retention of AI infrastructure specialists offers a prudent path to maintain technological exposure without succumbing to speculative excess.
Looking forward, sustaining alpha generation hinges on embracing the nuanced interplay between cyclical resurgence and ongoing technological innovation, particularly in sectors benefiting from fiscal incentives and supply chain realignments. Emerging market equities, including Chinese A-shares, present complementary growth avenues driven by industrial policy support and domestic demand expansion, further diversifying opportunity sets.
In sum, the mid-2026 market environment demands a disciplined, evidence-based approach reconciling growth and value paradigms. Aligning investment strategies with the identified rotation drivers and diversifying across sectors and capitalizations enhances prospects for navigating the evolving equity landscape with measured conviction and sustainable outcomes.
References
- Major Release: 26 Potential Stocks for 2026 Unveiled
- Shifting Investment Narratives Across Key Growth Sectors in 2026
- 2026 Outlook: Managing Wealth in an Age of Massive ...
- PDF Cetera Sector Insights
- Is Illumina (ILMN) a Great Long-Term Investment?
- 2026 Policy Outlook: Federal Priorities Shaping Key Sectors
- Is a Market Rotation Underway? The Sectors Leading in 2026 | EBC Financial Group
- PDF Macroeconomic Highlights Q1 2026 - advisor.vcm.com
- VYMI: This Global ETF Could Beat U.S. Tech Stocks for 10 Years
- PDF Viewpoint - mlaem.fs.ml.com
- 2025 Midyear Investment Outlook: All Eyes on the U.S.
- KOSDAQ Surpasses 1000 Points! What Are the Investment Strategies for the 'Thousand-Dock' Era?
- Mid-Cap Segment Surges 2.61% Led by Strong Breadth and Sectoral Gains
- 4 Biotech Stocks to Watch for Potential Upside in 2026
- From Silicon to Steel: The Great Sector Rotation of 2026 Redefines Wall Street | FinancialContent
- Navigating Divergent Innovation Pathways: A Comparative Analysis of GT Biopharma’s Clinical-Stage Growth and Roblox Corporation’s Platform Resilience in 2026
- K-Bio Left Behind in KOSPI's 7,000-Point Rally - What's Driving the Decline? - Yonhap Infomax
- Market Outlook for 2026: Positioning Portfolios for What Comes Next
- The global markets are an AI story…or are they? - The Economic Times
- [Special Report] China's Grand Inflection: Decoding the 2026-2027 Structural Bull Market & High-Tech Supercycle
- PDF 2026 Investment Outlook Chinese Equities
- 2026 Market Outlook Part 2: Positioning for China’s next chapter
- 2026 Global Capital Market: Potential Mega IPOs in Technology and Cryptocurrency | KuCoin
- U.S.-China Competition in Emerging Technologies
- Lithium Stock Forecast 2025-2026: Top Lithium Americas Picks
- Markets send the signals—ETF flows show where investors are headed
- VERTEX PHARMACEUTICALS INC. R (VX1.MU) Q1 FY2026 earnings call transcript
- VTEX (VTEX) Earnings Report: Key Numbers & Transcript Summary
- VTEX expects mid-single-digit 2026 subscription revenue growth FX-neutral, while targeting low-20s operating and free cash flow margins (NYSE:VTEX)
- Vtex (VTEX) Q1 2026 Earnings Call Transcript | The Motley Fool
- Vtex (VTEX) Q1 2026 Earnings Report Preview: What To Look For
- Vertex Pharmaceuticals (VRTX) Stock Falls on Q1 2026 Earnings | VRTX Stock News
- Gilead Sciences (GILD) Stock Dips While Market Gains: Key Facts
- What to Expect From Vertex Pharmaceuticals’ Q1 2026 Earnings Report
- After the bell May 4: Vertex schedules Q1 results and 4:30 webcast
- Gilead Sciences's Q1 2026 Earnings: What to Expect
- Budget Statement FY2026
- PDF Quarterly Sector and Investment Research Update | Q2 2026 | Fidelity ...
- PDF The Great Rotation of 2026 - jakespoto.com
- PDF Performance of Sectoral Indices and their relationship with NIFTY 50
- Equity Market Perspectives - Fidelity Institutional
- PDF S&P 500 Q1 Total Return −4. - myspg.com
- PDF Quarterly Sector and Investment Research Update | Q1 2026 | Fidelity ...
- 21 BFSI stocks gain over 25% in FY26; PSBs outperform, private banks decline
- Mid-Cap Segment Sees Mild Correction Amid Mixed Technical Upgrades
- UBS House View | March 2026
- PDF Sector business cycle analysis
- Jim Cramer’s Q1 2026 Market Review: AI Disruption Risks and Geopolitical Commodity Gains
- 2026Leading in the Intelligence Age: Excelling today, shaping ...
- Looking Ahead to the 2026 Q1 Earnings Season
- PDF Jennison Fundamental Equity Outlook - pgim.com
- Key charts to help identify current sector trends
- Analyzing the Energy Sector's Strong Earnings Outlook
- Q2 2026 Stock Market Outlook: Don’t Panic, Readjust
- [PDF] The BEAT | November 2025 - Morgan Stanley
- Top Trending Altcoins by Sector | Market Performance Analysis
- PDF JHL - cdn.prod.website-files.com
- 2026 Outlook: Tech Tonic — a broadening bull market
- Capital Market Outlook
- MAR 2026
- Global Investment Outlook
- [PDF] ETF Landscape: Industry Review – H1 2011 - Amazon AWS
- [PDF] Supply Chain Financing – Durable Global Trade in the Age of AI - Citi
- Tariff Impact on Pharma & Biotech Industry | Supply Chain Risks
- How Tariffs Are Reshaping Global Supply Chains in 2025
- Tariffs across the supply chain
- Geopolitical shifts, uncertainty, and investment: Evidence from the EIB Investment Survey 2025
- Navigating the Shifting Currents: U.S. Maritime Trade Policies in 2025 – Ship Universe
- PDF From factory to checkout: The supply chain story you didn't know you ...
- Impression Mixing Machine Market by Type, Technology, Application, End User - Global Forecast 2026-2032
- Artificial Turf Market by Fiber Material, Infill Material, Installation Mode, Application, End User, Distribution Channel - Global Forecast 2026-2032
- Paper Cups Market by Material Type, Capacity, Wall Configuration, Application, End-User, Sales Channel - Global Forecast 2026-2032
- Automated Waste Collection System Market Size 2026-2032
- Stock Screener - AlphaQuery
- India's Oil PSUs Lose ₹1,000 Crore Daily Amid Geopolitical Shocks | Whalesbook
- IEL Ltd. Share Price Today, IEL Ltd. Stock Price Live NSE/BSE Updates
- HYUNDAI MOTOR INDIA LIMITED CORPORATE ...
- PDF Cetera Sector Insights
- PDF Dividend Dynamics: Sector Perspectives - Ameriprise Financial
- NYSE: GIC - GLOBAL INDUSTRIAL stock analysis and financials
- Global Outperformers (Jenga Investment Partners Limited)
- Guide to the Markets - Europe
- Global Investment Outlook 2026 - Shifting Currents - Enterprise
- Q1 Tech Performance Review
- PDF Q1 2026 - d21buns5ku92am.cloudfront.net
- PDF Presentation - Capital Group
- PDF IIssue No. 53ssue No. 53 Markearkett Point
- PDF OUTLOOK 2026 - generali-investments.com
- Why Are Stocks at Record Highs with no Iran Resolution? | J.P Morgan
- Economic Outlook 2026
- Defense Electronics Market Size, Share | Growth Analysis [2034]
- Global Electric Household Appliance Testing Service Market Size, Share, Industry Trends & Forecast 2026-2034
- What are the Porter's Five Forces of Hyundai Glovis?
- Finding Stocks with Staying Power: The Quality Dimension
- South Korea Cables Market Size, Share, and Industry Trends Forecast 2026-2036 | MarkWide Research
- PDF On of Pricing Strategy in Marketing - Semantic Scholar
- Global Electronic Components Distribution Market Size, Share & Industry Forecast 2026-2034
- PDF State of Pricing 2025 - simon-kucher.com
- Global Power Amplifier Driver Market Size, Industry Share, Growth Trends & Forecast 2026-2034
- Industrials Industry Report - Q1 2026
- ESSENTIALS OF MARKETING
- Samsung Electro-Mechanics Deep Dive: Investment Thesis & Fair Value Analysis
- BUY LG Electronics India
- PDF Cross-Cultural Marketing Effectiveness in Global Brands ...
- PDF 10 Year Infrastructure Strategy - GOV.UK
- iRhythm (IRTC) Q1 2026 Earnings Transcript | The Motley Fool
- PDF Investors presentation Q3 2025 - cascades.com
- PDF Company report Viettel Construction JSC (HSX: CTR) A pioneer in the 5G Value Chain ADD
- UL Solutions Inc. R (72R.DU) Q4 FY2025 earnings call transcript
- PDF A PATHWAY TO LOCALISATION IMPACT: Laying the foundations
- How Does CJ Cheiljedang Company Work?
- Climate Change Debate | Global EV sales growth is slowing, with 2026 forecasts cut to 14%—significantly below previous years—due to expiring government incentives and pol... | Facebook
- EOI - Eaton Vance Enhanced Equity Income Fund Stock Price Forecast 2026, 2027, 2030 to 2050
- EOS - Eaton Vance Enhanced Equity Income Fund Ii Stock Price Forecast 2026, 2027, 2030 to 2050
- PDF March 2026
- World Economic Outlook, April 2026; Chapter 1: Global ...
- PDF February 2026 - ief.org
- Oil Market : 2025 - The Year That Was...
- [PDF] The Global Investment Outlook
- [PDF] Chemicals - maalot.co.il
- Immersion Cooling Market to Reach USD 4,917.0 Million by 2033 as AI Data Centers Adoption Accelerated
- COAL CURRENTS: Weekly Intelligence Brief for Metallurgical and Thermal Coal
- This energy stock nearly doubled in 2026. It still has more room to run, Raymond James says
- First Trust Market Commentary Blog - Cash Flow and Carey
- Financial Results for the year ended December 31, 2025
- Asset Allocation Insights - March 2026
- India’s core sector growth contracts 0.4% in March 2026 to lowest level since August 2024
- Investment Strategy | Wells Fargo Investment Institute
- Bio-Techne(TECH) Stock News
- 2026 Outlook
- PDF Healthcare & Lifesciences Report 2026
- PDF Sartorius Stedim Biotech | Earnings release Q1 2026
- CENTURY OF BIOTECH: CAPITALIZING ON THE ...
- Biotechnology Market Research Reports & Consulting from MarketsandMarkets
- PDF Biotech innovation is robust; when will financing return? - EY
- PDF Biotechnology Report 2025 - omegaconsulting.online
- Biotech IPOs stayed at slow pace, but grew larger in the first quarter of 2026
- Major biotech & pharmaceutical companies by revenue 2026| Statista
- How Principals Affect Students and Schools
- Sports Injury Status Survey by Gender and ... - Vol. 7 No. 2
- PDF Understanding an alternative approach to paramedic leadership
- PDF The Role of Leadership in Public Administration: A Comparative Analysis ...
- HOW PUBLIC SERVICE LEADERSHIP IS STUDIED
- PDF The Hersey and Blanchard s Situational Leadership Model Revisited: Its Role in ...
- THE EVALUATIONS RESEARCHES IN ADMINISTRATIVE ...
- PDF Understanding Leadership in Early Care and Education: A Literature Review
- [PDF] Review of research How leadership influences student learning
- [PDF] Investigating the Major Effect of Principal's Change Leadership on ...
- Trump Administration Tariff Actions (Sections 201, 232, and ...
- An Evaluation of the Post-2017 Shift toward Trade Wars and ...
- Trade and Structural Change: Focusing on the Specifics
- PDF Financial Stability Review, May 2025 - European Central Bank
- Financial Systems and Development - World Bank Document
- International Trade and Factor Mobility: An Empirical ...
- PDF Regional inequalities and human capital in Italy - univ-tln.fr
- The future of manufacturing in Europe
- Trade Protectionism 2026 and the New Global Trade Order
- Here’s What Pressured Meta Platforms (META) in Q1
- Techmeme: Sens. Kirsten Gillibrand and Dave McCormick introduce a bill banning members of the legislative and executive branches from trading on prediction markets (Jason Beeferman/Politico)
- Apple forecasts Q3 revenue above estimates, with sales expected to rise between 14% and 17%, and said memory expenses would be "significantly higher" in Q3 (Mark Gurman/Bloomberg)
- Apple CFO Kevan Parekh says "the iPhone 17 family is now the most popular lineup in our history" and "we believe we gained market share during the quarter" (Michael Acton/Financial Times)
- One Day, Four Earnings, $685 Billion in AI Spending
- Big Tech Q1 2026 Earnings Power $700B AI Capex Spree
- Tech giants report Q1, but do the numbers matter?
- Meta stock sinks after Q1 earnings as company raises 2026 AI spending forecast to $125 billion-$145 billion
- Meta Stock Drops 1.71% as Wall Street Braces for Q1 Earnings Amid $135 Billion AI Spending Blitz | IBTimes
- Microsoft May Have Its Worst Showing in 20 Years. Is It Too Cheap to Ignore?
- Cell And Gene Therapy Market Competitive Analysis 2026: Strategies Shaping Industry Growth
- Small Biotech Survival: Navigating Risk And Capital Scarcity With AI
- The Top 25 Biotechnology Companies of 2024 | The Healthcare Technology Report.
- The biggest biotech funding rounds in April 2026
- 3 Overlooked Stocks Set to Soar in 2026
- PDF EvaluatePharma World Preview 2020, Outlook to 2026
- Top 25 Biotech Innovations Redefining Health And Planet In 2025
- Extracellular vesicles: a growing pipeline still searching for validation
- FDA Approval Delays: How Biotech Is Adapting in 2026
- OECD AI Capability Indicators Technical Report
- AI code analysis implementation: Enterprise guide to strategic deployment and ROI measurement
- AI Infrastructure Market Size, Share | Forecast 2026–2035
- PDF The AIQ Framework: Turning AI Ambition into Measurable Impact
- PDF Nine AI Governance Frameworks Reshaping Enterprise Compliance
- Modernizing AI Without Disrupting Government | Carahsoft
- Translation
- AI Startup Strategy: A Blueprint to Building Successful Artificial Intelligence Products from Inception to Exit 9781484295014, 9781484295021 - DOKUMEN.PUB
- Embracing a new mindset to advance responsible AI maturity
- Risk-based AI assurance could transform AI regulation and oversight
- Industry Report: Specialty Chemicals Industry
- Solar Energy Perspectives
- GLOBAL TRENDS IN RENEWABLE ENERGY ...
- Chemicals Industry Analysis - Market Insight & Trends
- SK Chemicals Co.,Ltd Stock | Price, Analyst Rating & Outlook for 2026
- Green Chemicals Market
- PDF Chemical Sector Profile - Cisa
- European chemistry for growth
- Green Second Party Opinion
- [PDF] Pathways to Decarbonization: Natural Gas and Renewable Energy
- Eye on the Market podcast | J.P. Morgan Private Bank U.S.
- PDF Performance Insights US - April 2026 - lseg.com
- US Stock Market Boosted by Industrial Strength and AI-Driven Tech Spending Amid Mixed Earnings and Economic Data
- Pioneer Power Solutions, Inc. (PPSI) Competitors | Meyka
- Why Are Stocks at Record Highs with no Iran Resolution? | J.P Morgan
- This industry group is the star of 2026, besides energy. Trivariate says these stocks are a buy
- PDF Sector Scorecard February 2026 - SSGA
- Dow Jones Companies List: All 30 Dow Stocks, Tickers & Sectors (2025–2026) | InvestSnips
- PDF Hyperlocal Supply Chains: A Case-Based Framework for Establishing and ...
- Auto Parts Manufacturing Market Size Growth Report, 2034
- PDF Wind Turbine Manufacturer Deep Dive - interludeone.com
- Humanoid Robot Speed ??Reducers Market Outlook 2026-2032
- Car Power Sliding Door System Parts Market Outlook 2026-2032
- Submarine Companies - Top Company List
- Portable Sphere Spectrophotometer Market Size & Growth [2033]
- Diamond Tools Market Outlook 2025-2032
- Industrial Heavy Equipment Market Outlook 2026-2034
- Global Heavy Machinery Market Outlook 2026-2033: Trends, Opportunities, and Competitive Dynamics
- Release of oil reserves is a good start - Standard Chartered
- China’s corporate earnings lag behind stock market gains, survey finds
- China ETFs in Spotlight as Beijing Softens GDP Growth Target for 2026
- JPMorgan lifts China A-shares to overweight, sets 2026 CSI 300 target at 5,200-Jiemian Global
- Investment Outlook 2026
- China Petroleum & Chemical (SHSC:386) Stock Forecast & Analyst Predictions - Simply Wall St
- [PDF] Year Ahead 2026 | Escape velocity? - UBS
- What Lies Ahead for China ETFs in the New Year of the Horse?
- Certified Investment Management Analyst (CIMA) Certification
- Portfolio Allocation of Hedge Funds∗
- Navigating Alternative Investments and Exchange Funds: Strategies, Risks, and Portfolio Integration
- How can I use climate scenarios?
- R&D Project Portfolio Analysis for the Semiconductor Industry
- Measuring and Managing Market Risk | CFA Institute
- Annual Report 2024
- Risk Management of Financial Derivatives
- Brent Crude Prices Surge Amid Middle East Conflict Risk
- Investment Analysis: How to Conduct and Interpret Investment Analysis for Investment Estimation - FasterCapital
- GCC Artificial Intelligence Market is expected to reach USD 16,391.66 million by 2029
- Global Physical AI Market Forecast to 2032: Trends, Growth Drivers & Industry Insights
- It Market Strategic Insights: Analysis 2025 and Forecasts 2033
- On-device AI Market Size, Share & Trends | Industry Report, 2030
- On-Device AI Market Size & Share | Industry Report, 2033
- Autonomous Mobile Robots Market | Industry Report, 2033
- AI Powered Storage Market Size | Industry Report, 2030
- U.S. On-Device AI Market Size, Share | Industry Report, 2030
- AI Market: The Complete 2026 Market Analysis with Data, Trends & Predictions - Fungies.io
- Smart Worker Market Size, Share and Trend Analysis 2035
- The 15 Best Long-Term Investment Plans for First-Time Investors in 2026: The Ultimate Guide to Building Generational Wealth – Bitcoin News, Forecast, Technical Analysis, 8000+ Cryptocurrencies
- Best ETFs for 2026: Growth, Value & Sector Funds Ranked - paidpe
- 2026 CLA Economic and Market Outlook for Investors and Businesses
- Is the "Great Rotation" Reshaping Portfolios in 2026
- Value ETFs and Value Investing Strategy | WisdomTree
- International Large-Cap Value: The Forgotten Asset Class
- Are Value stocks staging a comeback in 2026?
- 2026 Healthcare Outlook
- PDF Q1 2026 Biopharma Licensing and Venture Report April 2026
- 2026 Healthcare and Life Sciences Investment Outlook
- PDF Global Life Sciences Industry Trends 2025
- PDF The Quarterly Rx: Q3 2025 U.S. Biopharma Recap - williamblair.com
- How can life sciences companies move faster on the deals ...
- PDF The Quarterly Rx - williamblair.com
- Q1 2026 Biopharma, Medtech Deal Reports
- PDF Q3 2025 Biopharma Licensing and Venture Report - J.P. Morgan
- Top 6 Biopharma Industry Trends in 2026: Innovations & Insights - Cora Systems
- Taekwang Industrial Analysis in May (2026) | Price Target, Profits & Valuation
- MSR shares woo investors ahead of HSX listing
- PDF 2024 Financial Review
- The earnings bedrock - Standard Chartered
- LS materials.,Ltd. stock | 2026 rating, price & analyst opinions
- Cosmo Advanced Materials & Technology Analysis (April) 2026 | Price, Valuation & Outlook
- 5 Dividend Stocks Raise Payouts for Steady Income Amid Volatility
- Financial Market Review for Q4 2025
- Goldman Sachs Pushes Fed Cut Outlook To Late 2026 As Energy Shock Keeps Inflation Elevated | IBTimes
- PDF "Look on every exit as somewhere else - mufgamericas.com
- Will Rates Fall in 2026? A Deep Dive Into Fed Policy and Market Expectations
- Fed Rate Forecast 2026: Will the Fed Cut, Hold, or Raise Rates?
- Federal Reserve keeps rate cut forecasts steady as economic growth, inflation outlooks rise
- Stocks And Oil: 3 Market Indicators To Track After Iran Escalation
- [PDF] Strategy Report - January 2026 Investors' Guide to FY26
- Most volatile Nasdaq Stock Market-listed stocks | volatility insights | Capital.com
- PDF A look at how key asset classes performed in 2023, how correlations ...
- Tech Earnings Forecast 2025 | Best Market Sentiment Analysis
- Understanding Bitcoin Correlation to Stock Market & Its Impact | BM Pro
- PDF US equity market betas - why they matter and how they are changing
- Bitcoin Market Cap Stumbles, Falls Behind Tesla’s Trillion-Dollar Valuation
- [PDF] Create Your Own ETF Hedge Fund
- Bitcoin is still a great way to diversify portfolio even if it trades like a tech stock, analyst says
- Bitcoin Price Prediction 2026, 2027, 2030, 2035, 2040: Can BTC Coin Reach $1,000,000?
- Long-term investor sentiment ends 2023 on a high as Fed pivots
- The Sum of All FEARS: Investor Sentiment and Asset Prices*
- PDF Choosing Sectors Over Style - WestEnd Advisors, LLC
- PDF Convertible Bond Arbitrage: An Analysis of Liquidity, Pricing and Investor Sentiment
- 2024 Q2 Global Market Outlook - Pent-up exuberance
- PDF Investor Intelligence Exchange
- The Stock Market's Fear & Greed Index Just Shifted Toward Greed. History Says This Is What Happens Next for S&P 500 Investors. | The Motley Fool
- PDF Investor Sentiment and Market Volatility: An Analytical Study in the ...
- Investor Sentiment and Market Volatility: An Analytical Study in the Context of Indian Stock Market
- [PDF] Jupiter Asset Management Series Plc - Banca Passadore
- PDF Working Paper - OFCE
- PDF Credit Crunches and the Great Stagflation - New York University
- PDF Impact of Capital Structure on Corporate Performance: A Sectoral Analysis
- PDF CEP Discussion Paper No 1673 Intellectual Property and the Organization of the Global ...
- Q1 2026 Earnings Highlights: Navigating Growth, Returns, and Risks Across Key Sectors
- PDF Social Capital, Opportunism, and Corporate Acquisition
- Turbocharge your sales and operations planning process
- EU productivity and competitiveness: An industry perspective
- PDF Investment Responses to Tax Policy under Uncertainty
- [PDF] The Practice of Industrial Policy: Government–Business ...
- Economic Bulletin Issue 2, 2026 - European Central Bank
- U.S. Firms' Exposure to Tariffs: A Comparison of the 2018 ...
- economic, financial and monetary repercussions (March 2026)
- Enhancing Resilience to Global Shocks: Economic Prospects ...
- PDF Australia Economic Outlook Q4 2025 - assets.kpmg.com
- Presentation on Results for FY2024
- Tariffs, Oil, and the Rupee: India's External Reckoning
- Global Trade Outlook
- Republic of Madagascar
- [PDF] The 2025 Trade War: Dynamic Impacts Across U.S. States and the ...
- Spotify Technology (SPOT) Is a Trending Stock: Facts to Know Before Betting on It
- Stock Screener: Most Volatile Stocks | MarketScreener
- Stock Screener: Best Value Stocks and Low Valuation Companies | MarketScreener
- POSCO Holdings Inc.: Fundamental Analysis and Financial Ratings | PKX | US6934831099 | MarketScreener
- Mirae Asset Securities Co., Ltd.: Fundamental Analysis and Financial Ratings | A006805 | KR7006801005 | MarketScreener
- HL Mando Corporation: Fundamental Analysis and Financial Ratings | A204320 | KR7204320006 | MarketScreener
- Shida Shinghwa Advanced Material Group Co., Ltd.: Fundamental Analysis and Financial Ratings | 603026 | CNE100001ZW4 | MarketScreener Canada
- Kiwoom Securities Co., Ltd.: Fundamental Analysis and Financial Ratings | A039490 | KR7039490008 | MarketScreener
- The Economic, Social, and Environmental Impact of ...
- SUNIC SYSTEM Co., Ltd.: Fundamental Analysis and Financial Ratings | A171090 | KR7171090004 | MarketScreener Canada
- CPI rose 4.6% in the year to March 2026
- PDF Sectoral price dynamics in the last mile of post-Covid-19 disinflation
- PDF II. Inflation: a look under the hood
- Global Economic Prospects
- Monetaria
- The inflationary impact of energy prices
- Back to the future: intellectual challenges for monetary policy
- Korea Development Institute
- [PDF] A EuropEAn union with 36 MEMbErs? pErspEctivEs And risks
- [PDF] BIS Annual Economic Report 2022
- ETFGI reports Active ETF Q1 net inflows were US$245.21 Billion which is up 70% from the prior record set in 2025
- ETFGI reports that assets invested in the ETFs industry globally reached a new record of US$17.34 trillion and US$1.09 trillion in YTD Net inflows at the end of July at end of July
- ETFGI reports Global ETFs Industry Sets Q1 Record as YTD net Inflows Surge 35% Past 2025 High
- ETF Fund Flows as of May 5, 2026
- ETF inflows hit record ₹1.8 lakh crore in FY26, driven by surge in gold, silver investments: Report
- ETF Inflows Break Records in 2026: SCHD, VOO, and the $524B Flow Map - Harry's Financial
- Active ETF Q1 Net Inflows up 70% From Prior Record - Markets Media
- The Gold Edge: ETF net inflows up 4.5x in FY26 - The Economic Times
- Materials Lead the Pack as Sector ETF YTD Inflows Top $13B
- TSMC Deep Analysis Report — Semiconductor
- MID-YEAR OUTLOOK 2026
- Create Presentations from Your Files in Clicks with Powerdrill Bloom
- what are the most undervalued stocks right now
- PDF Investment Research Update | Q1 2023 | Fidelity Investments
- Nomura Raises SK Hynix (000660.KS) Operating Profit Forecasts, Expects Long-term Supply Deals to Support High Profitability
- 2026 Outlook for Global Energy
- Smothering Heights
- Best Tech Stocks to Buy in 2026: Magnificent Seven & Beyond
- Intergenerational Report 2023
- 2026 Chemicals & Mining Industry Trends - Free Report | ITONICS
- Critical Minerals Market Review 2023
- USA Rare Earth Reports First Quarter 2026 Financial Results
- Market live updates: Wall Street record rally rolls on, oil tumbles on peace hopes, ASX rebound set to continue - ABC News
- Lithium Market Update: Elevated Prices Are Creating Favorable Dynamics for Miners | Global X ETFs
- Lithium Prices Surge Amidst Supply Disruptions MineListings.com
- Market cap leading rare earths companies globally 2026| Statista
- SQM Stock Gets $53 Price Target From BofA as Lithium Prices Rally
- Plum Acquisition IV (PLMK) strikes SPAC merger with geothermal and lithium developer CTR
- Economy Watch: Monitoring India's macro-fiscal performance
- Debt structure and its impact on financial performance
- PDF MONTHLY ECONOMIC REVIEW - dea.gov.in
- PDF Economy Watch April 2026 : Monitoring India s macro-fiscal performance - EY
- Bank credit growth rises 15.9% in FY26, driven by retail, NBFC and industry segments: Report
- PDF Banking Credit Offtake Set to Improve FY26 - careratings.com
- PDF Economy Watch : Monitoring India s macro-fiscal performance July 2025 - EY
- Economy Watch April 2025
- [PDF] MONTHLY ECONOMIC REVIEW
- [PDF] Financial Stability Review
- Nvidia Says China Key To CPU Growth
- Semiconductors and the CHIPS Act: The Global Context
- Bolstering and Securing Semiconductor Supply Chains | The National Bureau of Asian Research (NBR)
- Semiconductors at the Heart of the US-China Tech War | WITA
- PDF JETRO Global Trade and Investment Report 2024
- U.S. Industry, Global Competition, and Federal Policy
- PDF The Semiconductor Supply Chain: Assessing National Competitiveness - Gwern
- Humanoid Robots
- PDF The Semiconductor Supply Chain - Issue Brief
- [PDF][PDF] The semiconductor supply chain: Assessing national competitiveness
- PDF A System Dynamics Model for R&D Portfolio Management
- PDF Integrated Master Plan and Integrated Master Schedule Preparation and ...
- Tech Stocks Rally on AI Boom as Netflix Faces Investor Uncertainty Post-Earnings
- PDF ESG-Integrated machine learning portfolio opimization strategies ...
- Mid-Term Investment Strategies | Trade Johnson
- Portfolio Performance Analysis: Guide & Tips | Count
- Key charts to help identify current sector trends
- PDF Pattern Recognition and Prediction in Equity Market
- PDF Overview of Factor Investing | Investment portfolio building ...
- PDF Factor Indexing Through the Decades - MSCI
- Critical materials: Batteries for electric vehicles
- PDF The Macroeconomic Impact of Increased U.S. Electric Vehicle Battery ...
- Advanced battery materials Worldwide Market Reports
- Battery Raw Materials Market Size, Share | Report Forecast, 2031
- Advanced Battery Materials Market Forecasts to 2034 – Global Analysis By Material Type (Cathode Materials, Anode Materials, Electrolytes, Separators, Conductive Additives, and Binders), Battery Type, Form Factor, Technology, Application, End User and By G
- U.S Battery Materials Market Size, Share & Forecast 2026-34
- Battery Materials Market Insights, Share & Growth Report, 2034
- Battery Materials Market Growth, Demand & Size by 2034
- EV Battery Market Analysis: Industry Share, Trends, and Revenue with an Expected CAGR of 14% Over 2026-2033
- Battery Materials Market to Surpass USD 250.56 Billion by 2032, Reveals Maximize Market Research Analysis
- GlobalWafers (6488TT) Q1 2023 Earnings Call
- Gartner Forecasts Worldwide AI Chips Revenue to Grow 33% in 2024
- Artificial Intelligence Chips Market Outlook 2026-2034
- Artificial Intelligence Chip Market Report: Size, Growth, Trends & Forecast (2025–2033)
- Artificial Intelligence (AI) Chips Market Size | CAGR of 36.6%
- Al Chip Market Research and Global Forecast Report 2025-2030: Lucrative Opportunities in AI-Driven Diagnostics Expansion, Cloud Infrastructure Expansion and Rising Adoption of ASIC Technologies
- AI Chip Market Size, Share and Industry Trends, 2035
- Semiconductor Supercycle Explained: How AI and Geopolitics Are Reshaping $1 Trillion Tech Infrastructure | News | informedclearly
- AI Chip Market Size to Exceed USD 1354.35 Billion by 2035 | SNS Insider
- Artificial Intelligence (AI) Chipsets Market Size, Share & Outlook Report, 2034
- How fintech across GCC is growing up
- FII ownership hits 14-year low to 14.7%; DII cushions Indian markets with 18.9% rise: Report
- GXC: State Street® SPDR® S&P® China ETF
- PDF Mutual Fund Industry Update_February 2026
- PDF APAC Quarterly Trends Report
- PDF US PE Breakdown
- Sector Rotation Strategy: How to Follow Institutional Money in 2026 | TradeAlgo
- Trump Personally Brokered the Apple-Intel Deal That Sent Intel from $20 to $125
- AI-Powered Semiconductor Renaissance: AMD's Strategic Ascent Amid Market Rally
- AMD Q1 2026 Revenue Jumps 38% as AI Data Center, EPYC Servers and Global Cloud Clients Fuel Growth - InfotechLead
- AMD Q1 Revenue Soars to $10.3 Billion, AI Drives Growth | Phemex News
- AMD Q1 Revenue Rises 38% as Data Center Becomes Core Growth Engine
- Intel Reports 40% AI Growth in Q1 2026 but Stretched Valuation Prompts Caution
- Intel Q1 2026 Revenue Rises 7% as AI Demand Drives Growth Across Data Center and Foundry - InfotechLead
- Intel Q1 2026: Recovery Signals Strengthen, but the Turnaround Is Still Unfinished | Analysis.org
- Intel Q1 2026: AI Boom Drives Revenue Surge - The Digginator
- Intel Q1 2026: AI Drives 22% Data Center Growth, Foundry Revenue Up
- Three market trends to watch beyond war-driven headlines
- Quantum Stocks Surge: NVDA AI Sparks 500% Sector Boom
- PDF IT Hardware IT - kgi.com.hk
- Apollo Global president says it'll take 'all the markets' to fund AI spending
- PDF Cloud Trends 2025: Unveiling the Future of Cloud Technology
- PDF Advancing Cloud and Data Infrastructure Markets
- Hyperscaler capex > $600 bn in 2026 a 36% increase over 2025 while global spending on cloud infrastructure services skyrockets – IEEE ComSoc Technology Blog
- 10 best private cloud providers for 2026 | Nexcess
- [PDF] Bubble or Nothing: Data Center Project Finance
- Cloud Computing in 2026 | Long Island Cloud Services
- GY FOR POVERTY REDUCTION
- Based On Chapter 1 of the Global Energy Assessment (GEA)
- PDF G0sta Esping-Andersen - Lane Kenworthy
- Establishment of Algeria's National Vision 2030 2013
- PDF From territorial governance to the governance of public enterprises in ...
- Artificial Intelligence and National Security
- Conceptions of Educational Equity - ERIC
- Jean-Claude Bolay How to Think and Do Better Cities in the ...
- Digitalization and the Application of Artificial Intelligence in ...
- Do Giant Oilfield Discoveries Fuel Internal Armed Conflicts?
- Best AI Stocks to Buy in 2026: Top Picks for Smart Investors
- 2026 AI Investment Guide: From Infrastructure Boom to Revenue Reality
- AI Memory Stocks Analysis 2026: Top Picks in the Data Center Boom
- Prediction: The Great Rotation Will End Before 2026 Does. These Are the Best Artificial Intelligence (AI) Growth Stocks to Own When It Does.
- 2026 AI Stock Forecast: Best Picks for the ROI Era
- AI Infrastructure Stocks Rise Across Four Global Markets in April 2026
- Best AI Stocks to Buy in 2026: Top 7 Picks for Massive Growth
- AI Hardware Stocks Undervalued: Investment Opportunity in Nvidia, Broadcom, TSMC | 2026 - News and Statistics - IndexBox
- Forget the AI Sell-Off: These 2 Artificial Intelligence (AI) Stocks Are Actually Getting Cheaper While Their Businesses Get Stronger - The Globe and Mail
- Corporate Leverage in the AI Era | Alger On the Money
- AI Infrastructure: What It Is and Why It Matters for Modern AI Systems
- NVIDIA Spectrum X Powers the Next Wave of Gigascale AI Infrastructure NVIDIA Spectrum X Powers the Next Wave of Gigascale AI Infrastructure
- WINNING THE AI RACE
- AI Infrastructure: A Comprehensive Guide to Building a Modern AI Stack
- PDF Evolving Your Infrastructure for AI: Considerations for IT Leaders
- The AI Data Centre Jobs Boom: Industry Growth and Career Opportunities | EarthStream
- PDF The AI Infrastructure Investment Shift: From Hype to ROI
- Preparing Your Data Team for the AI Revolution
- Overcoming Challenges in AI Factory Implementation: A Practical Guide for Industry Leaders
- Industrial M&A Update - 2Q 2021
- Global-Economic-Prospects-January-2010. ...
- China’s Next-Generation Industrial Policy
- PDF 10 Macroeconomic Trends in 2026 - assets.kpmg.com
- PDF The Inflationary Effects of Fiscal Stimulus - Harvard Business School
- PDF Paper presentation Fiscal Stimulus with Supply Constraints
- China Auto Market Monthly Report 2024
- Energy Efficiency Market Report 2014 - Microsoft .NET
- PDF China Economic Monitor: 2025 Q4
- THE 1976 ECONOMIC REPORT O THE PRESIDENT ...
- Using factors for potential return enhancement - AP Institutional | Invesco
- Equity Sector Rotation Algorithms for Institutional Portfolios | Breaking Alpha Insights
- Mutual Fund Performance and Flows During the COVID-19 ...
- PDF Are You Really Capturing the Right Factors? - MSCI
- PDF INFRASTRUCTURE GOVERNANCE - World Bank
- PDF JOIM - Invesco
- PDF Global Equity Model (GEM) Handbook - Alacra
- PDF An Analysis of Hedge Fund Strategies - Opalesque
- Working Paper 24250
- Building Wealth with Asset Allocation Strategies
- Understanding the use of AI among small businesses
- artificial intelligence and automation in indian retail: strategic ...
- PDF Why Businesses Are Slow to Adopt AI: An Economic Perspective
- PDF Economy - hai.stanford.edu
- PDF The Rise of Industrial AI in America: Microfoundations of the ...
- The Robot Renaissance — China Investment, Global ...
- PDF Readiness for AI adoption of Philippine business and industry: The ...
- PDF Advanced Technology Adoption: Selection or Causal Effects?
- AI Adoption in Manufacturing: Insights from 100 Companies
- AI In Industrial Automation Market Size | Industry Report 2033
- Recovering Investor Expectations from Demand for Index ...
- Options on Leveraged ETFs: A Window on Investor ...
- PDF Impact of financial literacy on investment behavior among Gen Z. - JETIR
- Professional Asset Managers' Expectations and the Stock ...
- PDF 2025 Investment Company Fact Book - ici.org
- Unofficial Consolidation: Form 41-101F4 Information Required in an ETF Facts Document
- Guide to managing climate and environmental risks
- 5 ETFs Investors are Tracking in 2026
- PDF Global X Enhanced Canadian Oil and Gas Equity Covered Call ETF
- 3 Investment Themes for 2023
- Polar Capital Funds plc
- Sector & sub-industry ETFs
- PDF Presentation - mebfaber.com
- Sector Analysis: How Industry Trends Impact Company Performance | Wealthsimple
- PDF Quarterly sector and investment research update - Fidelity Investments
- PDF State Street Sector Chart Pack
- The Odd Couple of 2026: Cyclicals and Defensives
- BRIE Working Paper 2023-4 The New Logic of Globalization
- Science and Technology Issues for the 118th Congress
- Critical minerals for semiconductor manufacturing in the U.S.
- Market Update for the Advanced Materials Sector
- PDF Research and Development: U.S. Trends and International Comparisons
- PDF From industrial to digital with M&A - KPMG
- Potential Effects on Climate Change Mitigation
- Bad breaks: Why US tax policies put innovation at risk
- INDIA IN ASIA
- How innovation is changing where investors look for ...
- Rydex Funds Annual Financial Report
- PDF Quarterly Market Review
- Key Updates on the Economy & Markets Higher Oil Prices ...
- PARS/Monterey Peninsula RPD
- US small caps – Reasons to be cheerful - BNP Paribas Asset Management - Portugal
- PDF Total Return Chart - Vanguard®
- April 2026 Economic and Market Update: Geopolitics at the Forefront - Crestwood Advisors
- [PDF] Advisory Solutions Monthly Update (Non-Model)
- [PDF] Mellon Monthly Chart Pack
- Momentum and the Cross-section of Stock Volatility
- Research Affiliates
- RISK AND RETURN IN EQUITY MARKETS:
- PDF Focus: Momentum - MSCI
- PDF Morningstar Markets Observer
- PDF Momentum Turning Points - Top Traders Unplugged
- 2026 Long-Term Capital Market Assumptions
- FOCUS: MOMENTUM
- NBER WORKING PAPER SERIES FACTOR MOMENTUM ...
- PDF Chapter Three - Nacva
- The Energy Transition
- Monetary Policy and the Stock Market in the Covid Era - Federal Reserve Bank of Chicago
- Market Update Fourth Quarter 2024 | The Mather Group
- The Cyclical Nature of Growth vs. Value Investing
- PDF Nber Working Paper Series Does Inflation Affect Earnings Relevance? a ...
- 2026 US Equity Outlook Great Potential
- Growth vs Value: Which Performed Better?
- 2Q 2021 GMO Quarterly Letter
- [PDF] REPORT
- Nifty stays range-bound as resistance near 23,800 caps upside move - The Economic Times
- Defensive Equity Investing Without the Implicit Bets
- PDF Systemic risks and spillovers in the stock market of China: A sectoral
- US Stock Market Sectors - Updated Chart | LongtermTrends
- PDF The Business Cycle Approach to Equity Sector Investing
- Sector Rotation Strategy: Quantitative Signals for Timing Sectors | Blank Capital Research
- The US mid-cap opportunity: Looking beyond mega-cap momentum
- Market Capitalization: A guide | E*TRADE
- Indicators for Analyzing a Stock Investment
- Free Market Cap Calculator | StockCalculator.com
- PDF Overlooked and Undervalued: How Mid Caps Can Lead a Market Broadening ...
- Impact of Covid-19 on the Indian Stock Market - ijsate
- Torn between largecap and smallcap funds? The sweet spot may be in the middle - The Economic Times
- Long term SIP returns start to disappoint. A part of the blame lies with you
- Geopolitical threats and the reversal of equity size premiums - Journal of Asset Management
- Multi-Cap Funds: The power of 25-25-25 in the 2026 equity market