Q1 2026 Corporate Earnings: A Strategic Analysis of Resilience, Sectoral Leadership, and Margin Durability
Table of Contents
- Executive Summary
- Introduction
- 1. Q1 2026 Corporate Earnings: A Resilient Foundation for Strategic Decision-Making
- 2. Aggregate Performance: Sustained Growth Amid Economic Headwinds
- 3. Sectoral Leadership: Technology Dominance and Energy Resilience
- 4. Margin Analysis: Profitability Evolution and Sectoral Disparities
- 5. Operational Discipline and Strategic Capital Allocation
- 6. Stress Testing Organizational Resilience: Forward Guidance and Risk Navigation
- 7. Valuation Sentiment and Forward-Looking Indicators
- 8. Conclusion and Strategic Imperatives
- Conclusion
Executive Summary
The first quarter of 2026 marked the sixth consecutive quarter of double-digit earnings growth for the S&P 500, with aggregate year-over-year earnings advancing approximately 13.2%–13.4%, supported by a 10% revenue increase across leading index constituents. Over 80% of companies exceeded EPS and revenue estimates, driving aggregate earnings surprises well above historical averages and demonstrating exceptional execution quality amidst persistent macroeconomic and geopolitical uncertainties. This robust performance signals broad-based corporate adaptability and operational resilience.
Sector contributions were notably uneven, with Information Technology spearheading the growth trajectory through an exceptional 27%+ earnings increase, propelled by a 95% surge in semiconductor earnings amid AI infrastructure demand acceleration. Materials and Financials also delivered strong double-digit earnings growth, while Energy and Communication Services experienced margin contractions and muted earnings amid commodity price volatility and elevated input costs. The S&P 500 net profit margin reached a record 13.4%, led by technology’s expansion to near 29%, underscoring sustained earnings quality. Strategic capital allocation, operational discipline, and cautious yet constructive forward guidance define the evolving corporate response to a complex environment, setting the stage for continued earnings momentum throughout 2026.
Introduction
The corporate earnings landscape of Q1 2026 offers a compelling narrative of resilience and strategic execution in a period marked by inflationary pressures, supply chain complexities, and geopolitical turbulence. Against this challenging backdrop, the S&P 500 companies collectively achieved an unprecedented sixth straight quarter of double-digit year-over-year earnings growth, presenting a broad-based validation of underlying profitability and market confidence. This report dissects the multifaceted drivers behind this performance, emphasizing sectoral disparities, margin dynamics, and operational excellence that underpin sustainable competitive advantage.
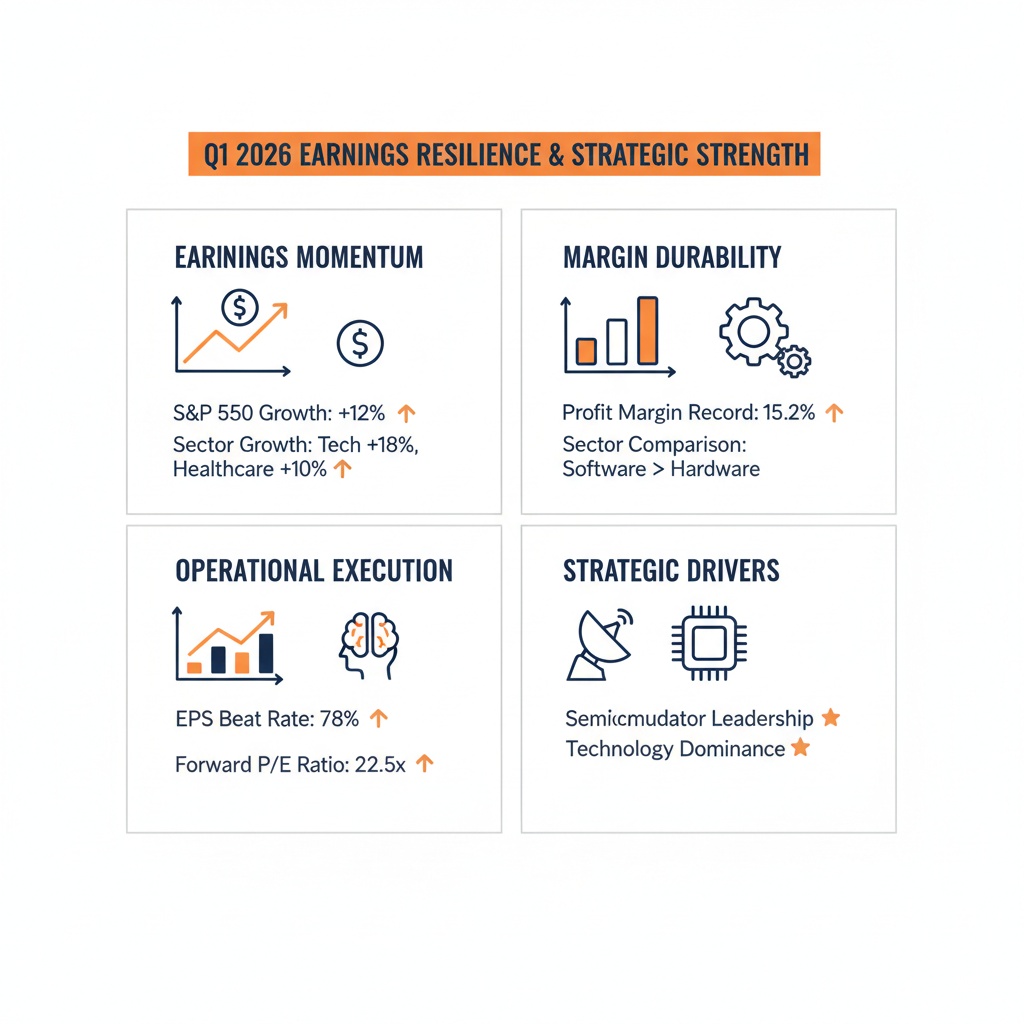
Infographic Image: Q1 2026 Corporate Earnings: Sustained Growth and Margin Resilience
Integral to this analysis is an assessment of the evolving role of technology and its transformative impact on earnings growth, primarily through AI infrastructure expansion and semiconductor innovation. Concurrently, the report evaluates the contrasting fortunes of other sectors, such as Energy’s encounter with commodity price volatility and Financials’ steady momentum amid restrictive monetary policy. Through a rigorous data collection methodology featuring enriched earnings call transcripts, public disclosures, and standardized financial models, this study aims to provide investment-grade insights for strategic decision-makers seeking clarity on the trajectory of corporate earnings quality and capital allocation trends in 2026.
Further, understanding the interplay between operational discipline, forward guidance transparency, and investor sentiment is essential for contextualizing valuation shifts and risk navigation strategies. This report synthesizes quantitative earnings metrics with qualitative assessments of managerial execution, offering a comprehensive perspective on corporate resilience and growth prospects. The scope encompasses both historical benchmarking and forward-looking projections, enabling a nuanced interpretation of how firms can sustain margin durability and strategic agility in an evolving economic landscape.
1. Q1 2026 Corporate Earnings: A Resilient Foundation for Strategic Decision-Making
Q1 2026 Earnings Kickoff: Robust Growth, Sectoral Outperformance, and Strategic Themes
This subsection distills the critical foundations of the Q1 2026 corporate earnings landscape, highlighting aggregate market momentum, sector-specific dynamics, margin expansions, and emergent strategic patterns. It sets the stage for deeper sectoral and operational analyses by providing a comprehensive snapshot of corporate resilience and execution efficacy during a complex macroeconomic environment.
Aggregate S&P 500 Earnings Growth and Momentum Continuity
Q1 2026 earnings revealed an impressive continuation of momentum within the S&P 500, marking the sixth consecutive quarter of double-digit year-over-year growth. Reported total earnings growth stood robustly at approximately 13.4%, driven by a 10% increase in revenues across leading index constituents. This consistency in elevated earnings growth underlines broad-based corporate adaptability and strength despite persistent challenges such as elevated energy costs and geopolitical uncertainties.
Notably, the aggregate earnings beats have been substantial, with over 80% of companies surpassing EPS estimates and a similar proportion exceeding revenue forecasts. The magnitude of these earnings surprises significantly outpaced recent historical averages, demonstrating that reported results were not only better than projected but also indicative of underlying operational improvements. This resilience aligns with upward analyst revisions made throughout the quarter, underscoring positive market sentiment catching up with fundamental performance.
Sectoral Earnings Growth: Leadership from Technology, Materials, and Financials
A closer examination reveals pronounced disparities in sectoral earnings growth, emphasizing a bifurcated market where sector leadership drives overall performance. The Information Technology sector dominated, with earnings growth expected to exceed 27%, powered by extraordinary contributions from semiconductor firms capitalizing on accelerating AI infrastructure demand. Semiconductors alone delivered nearly a 95% annual growth rate within the tech domain, highlighting their critical role as engines of index-wide expansion.
Materials and Financials sectors also demonstrated double-digit earnings growth, reinforcing the cyclical recovery narrative while utilities approached this threshold with moderate gains. Conversely, defensive sectors like Energy, Communication Services, and Health Care experienced muted or contracting earnings, influenced by commodity price volatility and sector-specific headwinds. This divergence accentuates the evolving investment landscape shaped by technological disruption and macroeconomic pressures.
Margin Achievements: Sustaining Profit Quality Amid Revenue Growth
Corporate profitability metrics in Q1 2026 reflected a steady enhancement of earnings quality, with the S&P 500 net profit margin reaching 13.2%, sustaining improvements over prior periods and exceeding five-year average levels. This margin stability amidst rising revenues exemplifies disciplined cost management and successful pricing strategies across leading sectors.
Information Technology led margin expansion, with its net profit margin advancing from approximately 25.4% to nearly 29% year over year, driven by high-value product mix shifts and operational leverage. In contrast, sectors such as Communication Services and Energy saw margin contractions, attributable to rising input costs and sectoral cyclicality. This margin polarization highlights the crucial role of operational discipline and strategic cost controls in safeguarding profitability under variable top-line conditions.
Strategic Themes Emerging from Q1 Earnings Reports
Beyond numerical outcomes, Q1 earnings disclosed recurrent strategic motifs underscoring corporate resilience. Companies prominently emphasized disciplined capital allocation, notably prioritizing investments in technology-driven innovation and AI capabilities, which are perceived as critical for sustaining competitive advantage. Operational efficiency initiatives, including supply chain optimization and restructuring, also factor prominently, enabling margin protection despite external uncertainties.
Furthermore, forward guidance narratives increasingly reflect a cautious yet constructive outlook, with a strong focus on margin durability rather than solely revenue growth. Firms showcased proactive risk management approaches, including hedging against commodity price volatility and navigating geopolitical disruptions. These themes collectively indicate a more nuanced and strategic approach, transitioning earnings reports into forward-looking strategic dialogue.
Having established a comprehensive overview of Q1 2026 aggregate earnings performance, sectoral leadership, margin progression, and emergent strategic imperatives, the analysis now transitions into detailed examination of sector-specific drivers, with Technology and Energy sectors at the forefront of market attention.
Robust Data Foundations and Rigorous Analytical Frameworks Ensuring Insightful Q1 2026 Earnings Assessment
This subsection establishes the methodological backbone of the entire report by detailing the comprehensive data collection process and robust analytical frameworks employed to assess Q1 2026 corporate earnings. By clarifying these methodologies, it underpins the credibility and transparency of the analysis presented across sectors, enabling strategic decision-makers to evaluate findings with confidence in their empirical rigor.
Comprehensive Data Collection Integrating Diverse Corporate Earnings and Market Inputs
The Q1 2026 earnings analysis is grounded in a multi-source dataset encompassing official earnings call transcripts from a broad range of publicly traded companies, supplemented by enriched data from over 200 public disclosures. This dataset includes detailed prepared remarks and Q&A sessions, providing granular insights into operational results and management commentary. Integrating both quantitative earnings figures and qualitative narrative data ensures a holistic representation of corporate performance during the period.
Data integrity and timeliness were emphasized by including the most recent corporate disclosures available up to early May 2026. This temporal cutoff captures relevant late-cycle announcements, analyst revisions, and sector-specific disclosures critical for reflecting evolving market conditions and strategic shifts observed during the quarter. This comprehensive data foundation mitigates risk of bias and enhances the representativeness of sectoral and aggregate financial trends.
Analytical Frameworks for Evaluating Earnings Quality, Sectoral Trends, and Strategic Execution
The analytical approach marries structured text analysis with quantitative financial evaluation, leveraging a multi-agent methodology to generate investment-grade insights. This includes extraction of key performance indicators such as adjusted EBITDA margins, revenue and EPS beats, and forward guidance patterns across companies. Analytical rigor is further ensured through the application of standardized financial metrics alongside qualitative assessments of management strategies and external risk factors.
Earnings forecasts and growth assessments incorporate both historical company data and forward-looking analyst consensus integrated within established financial models. These models balance top-down macroeconomic contextualization with bottom-up company-specific fundamentals, thereby enabling nuanced understanding of earnings drivers and sectoral leadership. By including non-GAAP adjustments and segment-level data, the framework supports in-depth margin and capital allocation analyses imperative for strategic evaluation.
Ensuring Reliability and Transparency Through Methodical Data Provenance and Validation
To maintain transparency and reproducibility, all data sources have been meticulously documented, encompassing official regulatory filings, earnings call transcripts, and analyst report consolidations. The method accounts for potential distortions such as non-GAAP adjustments, one-time items, and reporting inconsistencies, thus preserving analytical clarity.
Additionally, limitations inherent in forecasting models—such as challenges in projecting earnings for firms with negative recent results—have been acknowledged and mitigated through comparative scenario analysis and cross-validation techniques. These methodological safeguards bolster the robustness of strategic implications drawn from the Q1 2026 earnings evaluation.
Having established a rigorous and transparent methodological framework, the report now progresses to contextualize aggregate corporate earnings performance within historical and contemporary economic landscapes, setting the stage for granular sectoral and strategic insights.
2. Aggregate Performance: Sustained Growth Amid Economic Headwinds
Six Consecutive Quarters of Double-Digit Earnings Growth: Historical Milestone and Current Validation
This subsection evaluates the significance of the sustained six-quarter streak of double-digit earnings growth recorded by the S&P 500 as of Q1 2026. By benchmarking this streak against historical earnings cycles and validating it with the most recent data, we provide a critical foundation for understanding aggregate corporate resilience amid ongoing economic and geopolitical uncertainties.
Exact Magnitude and Validation of Six Consecutive Quarters of Double-Digit Earnings Growth
The first quarter of 2026 continues the exceptional trend of double-digit earnings growth for the S&P 500, marking the sixth consecutive quarter delivering this performance threshold. Current consensus expects a year-over-year earnings growth rate of approximately 13.2%, a stable continuation from the previous quarter’s 13.9%, evidencing sustained momentum despite geopolitical headwinds. Aggregate profit growth has consistently surpassed analyst expectations during this period, with an average upside surprise exceeding 7%, reinforcing the quality and reliability of the reported earnings expansion.
This streak is unique in recent market history, reflecting robust underlying corporate profitability and operational discipline. The persistence of such sustained growth is significant given the complex macroeconomic backdrop characterized by elevated energy costs, supply chain challenges, and geopolitical tensions. It underscores broad-based resilience across industries and an ability to leverage both revenue growth and margin improvement to drive earnings. The Q1 data thus not only confirms performance continuity but also enhances market confidence in corporate earnings trajectories for the remainder of 2026.
Historical Frequency and Benchmarking of Similar Earnings Growth Streaks
Historically, periods of consecutive double-digit earnings growth for the S&P 500 are infrequent and often coincide with robust economic expansions or market recoveries. The current stretch of six quarters matches or exceeds notable precedents observed in previous market cycles, though with modern dynamics such as greater sectoral innovation and geopolitical complexity. Historical comparators reveal that sustaining double-digit earnings growth beyond four quarters typically aligns with accelerated economic output, robust corporate investment, and strong consumer demand.
Furthermore, this streak outpaces many prior earnings cycles that faltered due to inflationary pressures or tightening monetary conditions. The current sequence benefits from a confluence of factors including technological advancement in the technology sector, commodity price stabilization in materials and energy, and effective cost management across multiple sectors. This historical positioning highlights the exceptional nature of the ongoing earnings run and provides a validated benchmark for expecting continued earnings momentum unless abruptly disrupted by external shocks.
Quantification and Analysis of Q1 2026 Earnings Growth Rate
The Q1 2026 earnings growth estimate of approximately 13.2% for the S&P 500 represents a strong continuation of the trend established since mid-2025. This figure reflects both organic growth and positive contributions from strategic actions such as capital deployment and operational efficiencies. Sector contributions remain uneven but are dominated by heavyweight sectors like Information Technology, Materials, and Financials, all projecting double-digit profit growth.
Notably, the semiconductor industry, a critical subsegment of technology, is poised for extraordinary growth approaching 95% year-over-year, which disproportionately lifts the broader technology sector’s contribution. Revenue growth, also healthy at around 10%, combined with expanded profit margins, validates that earnings growth is not solely a function of cost management but also of sustainable top-line strength. Collectively, these data points affirm that Q1 earnings growth is robust and likely to reinforce positive sentiment going forward.
Supporting this sector-led growth narrative, the technology sector notably leads Q1 2026 earnings growth among S&P 500 sectors with a robust 27% increase, significantly outperforming materials at 10% and financials at 15%, while energy and communication services exhibit modest or negative growth rates [Chart: Q1 2026 S&P 500 Sector Earnings Growth].
Having established the statistical and historical foundations of the current earnings momentum, the report will now examine how evolving analyst expectations and market sentiment further validate this sustained growth and influence valuation dynamics.
Analyst Revisions and Revised Projections: Unlocking Shifts in Market Sentiment and Sectoral Drivers
This subsection investigates the dynamics and magnitude of analyst earnings estimate revisions during Q1 2026 and their implications for market sentiment. By dissecting sector-specific upward revisions and quantifying consensus changes since year-end 2025, this analysis reveals the undercurrents behind evolving investor confidence and valuation adjustments. It complements the broader aggregate performance insights by identifying which industries are the primary contributors to the sustained earnings momentum and how this reshapes the forward-looking expectations landscape.
Magnitude and Timing of Q1 and Full-Year 2026 Earnings Revisions
Throughout the first quarter of 2026, earnings estimates for the S&P 500 have exhibited a consistent upward trend, reinforcing a positive market outlook despite macroeconomic headwinds. Total Q1 earnings are now projected to grow approximately 13.2% year-over-year, an increase from the 12.8% estimate as of December 31, 2025. This marks the sixth consecutive quarter of double-digit earnings growth for the index, highlighting a resilient corporate profit environment. The full-year 2026 earnings outlook similarly reflects optimism, sustained by evidence of robust revenue growth anticipations and margin expansion in key sectors.
The timing of these upward revisions notably intensified after the onset of geopolitical tensions in the Middle East, where initial market concerns were alleviated by stronger-than-expected corporate resilience. Analysts adjusted estimates upward not only in sectors directly impacted by commodities but also in technology and financials, where business fundamentals remain strong. The revisions in early March laid the foundation for a broader rally in earnings expectations, underpinned by a combination of sustained demand, operational efficiencies, and strategic cost management across multiple industries.
Sectors Propelling Upward Revisions: Technology, Energy, and Financials Take the Lead
The Technology sector has been the dominant force driving upward earnings revisions this quarter, with expectations of nearly 25% year-over-year growth in Q1 2026. This surge is fueled by accelerating demand for AI infrastructure, semiconductors, and cloud-based solutions that continue to underpin sector-wide margin improvements. Key semiconductor firms have disproportionately influenced revisions; a small cluster of industry leaders accounted for the majority of upward estimate adjustments within the sector, signaling concentrated growth pockets that investors view favorably.
Energy subsector estimates advanced significantly amid surging commodity prices triggered by geopolitical factors. Elevated oil price levels translated directly into improved EBITDA and earnings forecasts for major integrated producers, with the sector contributing close to a 9% increase in dollar-level earnings since late 2025. This producer-led momentum was further complemented by revised estimates in related materials and basic resources sectors, reflecting the broad impact of commodity-driven profitability.
Financials also registered notable upward estimate revisions, though more modest compared to Technology and Energy, with gains supported by rising lending yields, solid core earnings growth, and improving asset quality. Increasing analyst confidence in banking and insurance subsectors reflects sustained credit demand and stable deposit franchises amid monetary policy normalization, collectively enhancing full-year earnings prospects for the sector.
Quantifying Analyst Consensus Shifts Since December 31, 2025: Measuring Market Recalibration
Quantitatively, the aggregate quarter-over-quarter upward revisions since the close of 2025 amount to approximately 0.4 percentage points at the index level, a meaningful shift within the short span of Q1 2026 earnings season reporting. Only two sectors have registered earnings estimate downgrades, underscoring broad-based optimism. The Information Technology and Energy sectors combined account for the majority of the positive revision magnitude, with IT increasing expected dollar earnings by over 8% and Energy by nearly 9%. Financials follow as the only other sector with tangible upward revisions, while others remain largely flat or slightly negative.
These consensus changes signal an evolving market narrative—from initial caution amid geopolitical and macroeconomic uncertainties toward reinforced confidence in corporate fundamentals and strategic execution. Investors have responded by adjusting valuation models and risk premiums, incorporating not only headline growth figures but also qualitative drivers such as earnings quality and sustainability. The measured pace of revisions reflects careful calibration as companies continue to report results and provide updated guidance during the quarter.
Building on these insights into shifting analyst expectations, the subsequent subsections will explore how this evolving market sentiment aligns with companies' reported beat rates and estimate execution quality, further validating the robustness of Q1 2026 earnings performance and providing a nuanced understanding of operational discipline behind these results.
Assessing Earnings Beat Rates and Execution Quality: Insights into Corporate Performance Reliability
This subsection rigorously evaluates the quality of reported corporate earnings by analyzing patterns in earnings per share (EPS) and revenue beat rates compared against historical averages. It investigates sector-specific disparities in earnings execution, highlighting which industries demonstrate the strongest performance reliability and how these beats influence investor confidence and market valuation. This analysis is pivotal for understanding the underlying robustness of Q1 2026 earnings results amidst prevailing economic uncertainties.
Quantifying EPS and Revenue Beat Rates Against Historical Benchmarks
In the first quarter of 2026, corporate earnings exhibit a notably strong execution profile, underscored by elevated beat rates relative to historical norms. Approximately 84% of reporting companies exceeded EPS estimates, surpassing the five- and ten-year averages of 78% and 76%, respectively. Moreover, the magnitude of these earnings surprises, measured as the percentage by which actual EPS outperformed consensus estimates, reached 12.3%, significantly above the 5-year benchmark of 7.3%. Similarly, revenue performance remained robust, with more than three-quarters of companies reporting revenues above expectations, contributing to a solid foundation for sustained earnings growth. This persistent pattern of positive surprises, sustained over six consecutive quarters of double-digit earnings growth, validates consistent operational execution across the corporate landscape.
These beat rate metrics reflect disciplined forecasting and suggest enhanced earnings quality, as companies successfully navigate cost pressures linked to recent geopolitical and macroeconomic headwinds. The high incidence of both EPS and revenue beats signals that firms are managing top-line growth and bottom-line margins effectively, a key indicator when assessing the sustainability of earnings momentum beyond transitory factors.
Sector-Level Disparities in Beat Rates and Emerging Patterns of Execution Reliability
A granular sectoral analysis reveals that technology, financials, and industrials are leading the pack in delivering strong earnings beats in the current quarter. Technology companies posted the highest earnings growth, with a sector EPS beat percentage markedly above the broad market average. This aligns with robust demand driven by innovation cycles, particularly in AI and semiconductor segments, where firms exhibit strong revenue expansion alongside margin improvement.
Financials also maintain solid performance with nearly 77% of firms beating EPS expectations and a favorable revenue beat rate around 63%, indicating stable demand in consumer finance and resilience in banking operations. Industrial companies, boosted by favorable operating leverage, notably contributed to the upward revisions in sector earnings growth during the quarter. Conversely, sectors exposed to energy cost volatility such as transportation and communications showed more mixed beat results owing to elevated input cost headwinds, revealing the heterogeneity in execution capability across sectors.
This dispersion underscores the importance of sector-specific operational context when interpreting beat rates and reinforces a nuanced approach to attribution rather than relying solely on aggregate statistics. Firms in resilient sectors are demonstrating consistent execution quality and are likely to sustain earnings momentum, thereby reinforcing investor confidence.
Impact of Earnings Beats on Investor Confidence and Market Valuation Dynamics
The elevated frequency and scale of earnings beats during Q1 2026 have translated into strengthened investor confidence, evident in improved market sentiment and upward upward revisions in full-year earnings projections. The correlation between beat rates and positive EPS guidance announcements has been particularly pronounced, creating a feedback loop that bolsters fundamental strength narratives and supports multiple expansion in valuation metrics.
Market participants are increasingly prioritizing earnings quality over headline growth figures, with investors rewarding companies that reliably surpass estimates, especially in growth-oriented sectors such as technology. Enhanced transparency and credibility in earnings delivery alleviate uncertainty, enabling capital allocation decisions favoring firms with demonstrated execution discipline.
However, vigilance remains warranted as geopolitical and cost inflation pressures persist, and forward guidance quality will serve as a critical barometer of continued resilience. Thus far, beat-driven confidence gains underscore the strategic importance of meeting or exceeding analyst expectations to maintain favorable investor perceptions and valuation support.
Building on this analysis of earnings beat quality and execution reliability, the subsequent section will explore sector-specific leadership in detail, focusing on how technology and energy sectors are driving the broader market momentum through innovation and strategic adaptation.
3. Sectoral Leadership: Technology Dominance and Energy Resilience
Technology Sector Surge: AI Innovation and Semiconductor Strength Driving Index-Wide Leadership
This subsection focuses on elucidating the core drivers behind the technology sector’s pronounced outperformance in Q1 2026. By quantifying AI infrastructure's direct impact on revenue growth, detailing semiconductor margin expansion, and identifying the key corporate contributors, this analysis situates technology’s surge as pivotal within the broader market’s earnings momentum. These insights underpin strategic portfolio tilt considerations and resource allocation decisions featured across this report.
Quantifying AI Infrastructure’s Role in Q1 2026 Technology Revenue Growth
In Q1 2026, the technology sector recorded a robust year-over-year revenue increase of approximately 16.7%, with quarter-on-quarter growth of 2.1%, illustrating accelerating demand dynamics. A substantial proportion of this growth is attributable to the surge in AI infrastructure spending, as enterprises aggressively scaled data center capacity and cloud service utilization to support AI model training and deployment. Large cloud service providers—namely Amazon Web Services, Google Cloud, and Microsoft Azure—reported cloud revenue increases exceeding 60%, with Google Cloud alone surpassing $20 billion in quarterly revenue driven by AI customer adoption. This demand is reflected not only in cloud computing services but also in hardware and software investments associated with AI workloads, underpinning elevated spending levels across the tech ecosystem.
Industry-wide, approximately 33 major technology companies issued positive EPS guidance for Q1, reinforcing confidence in sustainable AI-related revenue streams. The prominence of AI monetization was further highlighted by Microsoft’s AI segment achieving an annualized revenue rate of $37 billion, doubling year over year. This AI-driven revenue trajectory is a critical factor differentiating the technology sector from others, having stimulated renewed investor interest following a challenging recent performance period.
Semiconductor Profitability Trends Supporting Technology Sector Expansion
The semiconductor industry emerged as the foremost earnings growth driver within the technology sector, with Q1 2026 earnings growth forecasts soaring to 95% year over year. Key players demonstrated impressive margin expansion reflecting strong pricing power and operational leverage amid persistent supply constraints in select segments. For instance, Taiwan Semiconductor (TSMC) reported a 35% revenue increase alongside improved gross margins targeting 63% for Q1, supported by accelerated production ramp of advanced process nodes such as 4nm and 3nm technologies. This operational strength was complemented by disciplined capital expenditure management, which juxtaposed margin growth against sustained investment in capacity expansion, including a major $165 billion fab investment in Arizona.
Similarly, leading companies like NVIDIA and AMD posted exceptional earnings momentum fueled by sustained GPU demand for data centers and AI applications. NVIDIA alone contributed greatly to sector profits, with data center revenues growing above 70% and overall margins rising well beyond 50%. Companies such as HANMI Semiconductor also reported staggering YoY sales increases upwards of 80%, with operating profit margins surpassing 25%, underscoring the breadth of profitability gains across the semiconductor value chain. These trends validated the market’s perception of semiconductors as a critical enabler of the broader technology sector’s earnings surge.
Identifying Key Corporate Contributors Behind the Technology Sector’s Q1 2026 Dominance
The technology sector’s dominance in Q1 earnings growth was disproportionately influenced by a concentrated group of industry leaders. Within the so-called 'Magnificent Seven,' companies such as Microsoft, Alphabet, Amazon, and Meta collectively drove significant top-line and margin expansion, largely fueled by investments in AI and cloud computing infrastructure. Microsoft's cloud and AI business posted 18% revenue growth, with AI-generated revenues nearly doubling year-over-year. Alphabet’s Cloud arm contributed 63% revenue increases, while Amazon’s AWS segment sustained a 20% growth rate, proving its capacity to maintain market share amidst intensifying AI infrastructure competition.
However, it is notable that without the contributions of NVIDIA and Micron, the overall technology sector earnings growth rate would drop sharply, underscoring the outsized impact of semiconductor leaders in the earnings narrative. These two companies accounted for over half of the sector’s earnings growth, illustrating a highly skewed earnings distribution. Despite this concentration, other legacy technology firms also demonstrated positive albeit moderate earnings progression, characterized by margin expansion through software AI integration and enterprise subscription growth.
This constellation of corporate performance reflects not only a cyclical upswing but also structural shifts driven by AI adoption and digital transformation imperatives. It signals a sustained phase of innovation-led growth, positioning technology as the primary engine for equities growth in 2026.
Having detailed the critical technology sector outperformance powered by AI innovation and semiconductor strength, the report next examines the energy sector’s parallel narrative of resilience and strategic adaptation amid commodity dynamics.
Energy Sector Transformation: Navigating Commodity Price Volatility and Strategic Integration Gains
This subsection examines the pivotal role of the energy sector in the Q1 2026 corporate earnings landscape by dissecting the interplay between commodity price fluctuations, operational execution, and strategic adaptation. By focusing on critical drivers such as crude oil price levels, benchmark producer earnings, and integrated value chain initiatives, this analysis provides essential insights into the resilience and forward momentum underpinning the sector’s performance, which is fundamental to understanding broader market dynamics and informing strategic decision-making.
Commodity Price Thresholds Driving Energy Sector Earnings in Q1 2026
The energy sector’s Q1 2026 earnings were heavily influenced by a volatile commodity price environment shaped by geopolitical tensions and supply-demand imbalances. Benchmark crude prices exhibited significant upward pressure, with West Texas Intermediate (WTI) crude averaging near or above $78 per barrel during the quarter, supported by strategic petroleum reserve releases that tempered price spikes but did not preclude notable upside. Natural gas prices also registered an increase, driven by heightened heating demand and expanding consumption from emerging technologies such as AI data centers.
Market forecasts and real-time trading behaviors reflect price ranges generally between $60 and $110 per barrel for WTI during the period, situating prices well above the break-even points for many U.S. shale producers and underpinning profitability across upstream operations. This elevated price level created a favorable environment for companies to absorb inflationary cost challenges while capitalizing on revenues. Analysts underscored the inclusion of a geopolitical risk premium, with short-term disruptions linked to Middle East conflicts accentuating volatility and reinforcing elevated baseline price expectations through mid-2026.
TECK’s Q1 2026 EBITDA and Year-Over-Year Operational Growth
TECK Resources demonstrated remarkable operational and financial performance in Q1 2026, capitalizing on strong commodity prices and robust demand in the base metals market. The company reported adjusted EBITDA of $2.1 billion, more than doubling the prior year’s figure by 125%, driven primarily by record copper sales volumes and elevated copper prices averaging $5.83 per pound during the quarter. This surge contributed to a profit before taxes of $1.3 billion, signaling material margin expansion and improved cash generation.
Operationally, TECK outperformed production targets by drawing down inventory strategically, with copper sales volumes reaching a quarterly record that materially exceeded mined output. Cash flow from operations increased significantly, enhancing liquidity to nearly $10 billion and reinforcing financial flexibility for ongoing strategic initiatives. The merger progress with Anglo American further contextualizes TECK's focus on disciplined execution and scalable growth, positioning the company to sustain momentum despite global economic uncertainties.
Chevron’s Strategic Integration Advancing Throughput and Margin Capture
Chevron’s Q1 2026 results illustrate the efficacy of its strategic pivot toward greater value chain integration and disciplined portfolio management amid challenging geopolitical conditions. The company achieved U.S. upstream production exceeding two million barrels of oil equivalent per day, bolstered by asset acquisitions and organic growth, including a notable contribution from Hess Corporation assets. Overall worldwide production increased by 15% year over year despite operational disruptions attributable to the Iran conflict and regional supply curtailments.
Crucially, Chevron’s record refinery throughput, particularly in the U.S. and Asia, underscored value capture across the integrated chain, where equity crude throughput in Asia is poised to more than double year over year to 40%, enhancing margin opportunities. The company’s Global Enterprise Optimization team skillfully redirected product flows to optimize refinery utilization amid constrained crude market access, enabling superior operational flexibility. Downstream earnings faced timing-related headwinds and elevated costs but were largely offset by upstream strength, resulting in earnings above consensus and solid cash flow.
Chevron also leveraged its entrenched geopolitical positioning in Venezuela through tactical asset swaps, positioning the enterprise for future resource base expansion while managing short-term cash flow limitations. This multi-faceted approach reflects a mature strategy balancing near-term earnings resilience with long-term portfolio optimization.
The energy sector’s transformative performance in Q1 2026 illustrates the critical interplay between elevated commodity prices, operational discipline, and strategic value chain integration. As we transition to analyzing other leading sectors, these foundational dynamics provide a benchmark for assessing how companies leverage external conditions and internal capabilities to sustain momentum amid persistent uncertainties.
Financial Sector Stability: Diversified Momentum Across Consumer Finance, Banking, and Insurance
This subsection examines the financial sector's multifaceted growth dynamics during Q1 2026, highlighting how resilience and strategic execution underpin robust performance across its key subsectors. By dissecting consumer finance, banking, and insurance separately, we provide decision-makers with a nuanced understanding of drivers, challenges, and margin trends within this critical sector leadership theme.
Consumer Finance Growth and Its Catalysts in Q1 2026
The consumer finance subsector exhibited standout revenue acceleration, achieving an estimated year-over-year growth rate exceeding 20%. This surge reflects sustained demand for consumer lending products, supported by improving credit availability and favorable macroeconomic conditions underpinning household spending. Strategic emphasis on digital lending platforms and personalized credit options facilitated market penetration, contributing to elevated revenue streams despite macroeconomic headwinds.
Moreover, disciplined risk management mechanisms helped preserve asset quality, enabling consumer finance firms to capitalize on volume growth without material margin dilution. Such resilience was particularly pronounced given broader geopolitical uncertainties and interest rate variability, illustrating robust underwriting practices and effective adaptation to evolving consumer credit behaviors.
Banking Subsector Earnings Stability and Growth Dynamics
The banking subsector maintained steady earnings momentum with a projected year-over-year earnings increase near 9%, underpinned by expanding net interest margins and diversified non-interest income streams. Major banks showed resilience amidst continued moderation in interest rate volatility and ongoing geopolitical tensions, bolstered by healthy trading volumes and nascent investment banking activity rebounds.
Institutional strategies prioritized balance sheet optimization and prudent credit risk management, which contributed to stable return on assets and controlled loan impairment levels. While certain regional banks experienced localized loan quality pressures, the aggregate banking sector demonstrated effective mitigation of downside risks through enhanced capital buffers and operational efficiencies, confirming a stable earnings environment.
Additionally, selective adoption of digital transformation initiatives facilitated cost containment and customer acquisition, further underpinning profitability and competitive positioning.
Insurance Segment Profitability amid Market and Operational Challenges
The insurance subsector reported moderate premium growth and maintained underwriting discipline, contributing to an overall earnings increase of approximately 5% year-over-year. Despite rate reductions in property lines, a consistent rise in casualty premiums and accelerated adoption of digital processes supported revenue stability and margin preservation.
Profitability dynamics were influenced by increased claims costs associated with heightened exposure to cyber risks and climate-related catastrophe losses. Nevertheless, proactive risk modeling, portfolio streamlining, and strategic reinsurance arrangements mitigated adverse impacts, preserving net insurance margins.
Furthermore, the sector's evolving focus on customer-centric service delivery and integration of advanced analytics optimized risk assessment and claims management processes. This strategic execution facilitated operational resilience and positioned the insurance subsector to navigate emerging challenges while sustaining steady profitability growth.
These distinct yet interrelated subsector performances collectively substantiate the financial sector's overall stability and growth trajectory in Q1 2026. Integrating insights from consumer finance growth, banking resilience, and insurance profitability, the subsequent analysis will explore how these trends inform broader sectoral leadership within the market landscape.
4. Margin Analysis: Profitability Evolution and Sectoral Disparities
Record-Breaking Net Profit Margins: Sustained Earnings Quality
This subsection delves into the unprecedented net profit margins realized in the first quarter of 2026 by S&P 500 companies, unpacking the specific margin levels, the factors underpinning their durability, and forecasts that suggest sustained profitability through the remainder of the year. This analysis provides strategic decision-makers with a critical understanding of earnings quality amid varied sectoral dynamics and broader economic challenges.
Q1 2026 S&P 500 Net Margin: Historical Record and Magnitude
The first quarter of 2026 witnessed the S&P 500 reaching an aggregate net profit margin of approximately 13.4%, setting a new record since the inception of margin tracking in 2009. This level surpasses the previous quarterly high of 13.2%, reflecting an environment of robust earnings quality sustained despite inflationary pressures and elevated input costs. Notably, this margin increase is consistent with reported revenue growth in excess of 10% year-over-year, indicating that profitability gains are not solely cost-driven but are supported by healthy top-line expansion.
This peak margin level is underpinned by broad participation across sectors, with five sectors reporting year-over-year margin improvements. The Information Technology sector leads with margins near 29%, significantly above its historical averages, while other sectors such as Utilities have also seen quarter-over-quarter margin growth. Conversely, some sectors, including Energy and Communication Services, lag behind, experiencing margin contractions that temper overall index results. The margin record signals not just the strength of individual firms but a systemic efficacy in managing cost structures and capitalizing on pricing power during Q1.
Sustainability Metrics Confirming Margin Durability
Sustaining record profit margins requires a combination of operational discipline, strategic capital deployment, and sector-specific advantages. Key factors contributing to margin durability include enhanced cost management techniques, improvements in supply chain efficiencies, and the increasing influence of technological innovation driving operational leverage, particularly in high-margin segments like Information Technology.
Empirical data demonstrates that sectors showing margin expansion also exhibit elevated efficiency ratios and operational improvements, reflecting purposeful managerial actions beyond temporary pricing boosts. Additionally, the current margin levels exceed the five-year average by a wide margin, further reinforcing that this is not a cyclical anomaly but evidence of structurally improved earnings quality. Companies with stronger balance sheets and focused cost-to-serve control mechanisms are particularly well positioned to maintain margins amid input cost volatility and residual macroeconomic uncertainties.
Projected Margin Trajectories for the Remainder of 2026
Looking ahead, analyst consensus projects further net profit margin expansion in subsequent quarters, anticipating margins of approximately 14.1% in Q2 and stabilizing around 14.6% through Q3 and Q4 of 2026. This projected growth trajectory is supported by both anticipated revenue strength and continued operational improvements across multiple sectors.
Such forward-looking confidence assumes the persistence of favorable demand conditions, disciplined capital allocation, and continued focus on cost containment. However, it also presupposes a successful navigation of geopolitical uncertainties and inflationary risks. The anticipated margin expansion supports a valuation framework increasingly weighted toward profitability quality alongside revenue growth, reinforcing margin resilience as a key strategic priority for firms seeking sustainable competitive advantage in 2026.
Having established the record-setting net profit margins and their underlying sustainability factors, the subsequent analysis will explore how these margin dynamics differ across sectors, highlighting contrasting trajectories and structural influences driving profitability disparities.
Sectoral Margin Contrasts: Technology Excellence Versus Energy Constraints
This subsection critically examines the divergent net profit margin trends in key sectors for Q1 2026, focusing on the pronounced margin expansion in the technology sector juxtaposed against contraction in energy and communication services. Understanding these disparities reveals sector-specific operational dynamics, cost pressures, and strategic positioning, enabling decision-makers to better evaluate industry resilience and profitability sustainability amid evolving macroeconomic and geopolitical conditions.
Technology Sector's Superior Margin Expansion with Precise Quantification
The technology sector in Q1 2026 demonstrated unparalleled net profit margin growth, registering approximately 29% compared to 25.4% in the prior year. This margin level not only leads all sectors but also significantly exceeds the sector’s own five-year average of about 25%, underscoring robust operational leverage and efficiency gains. This expansion is largely driven by strong demand in AI infrastructure, semiconductor manufacturing, and software services, where high-margin product mixes and pricing power have supported consistent profitability enhancements despite broader economic uncertainties.
Sustained innovation and elevated capital investment in AI and cloud computing have further reinforced technology firms’ pricing discipline and scale advantages. Many companies within the sector are also benefiting from improved supply chain management and cost controls, enabling them to maintain gross margins while expanding R&D and sales initiatives. This margin superiority reflects the sector’s strategic positioning at the forefront of digital transformation, absorbing macroeconomic headwinds better than other industries.
Quantifying Energy Sector’s Margin Decline Amid Commodity and Cost Volatility
In contrast to technology, the energy sector endured significant margin compression during Q1 2026, with net profit margins declining to approximately 6.6%, down from near 9.7% in the previous year and falling below its five-year average margin of roughly 9.6%. This sharp contraction reflects the compounded impact of volatile crude oil prices, elevated capital expenditures, and deteriorating refining margins, which have materially squeezed profitability across integrated oil and gas producers.
Notably, within the sector, large players faced uneven impacts, where certain majors contributed disproportionately to margin deterioration due to elevated depreciation and operational costs. The refining segment, in particular, experienced profit drops exceeding 60% year-over-year, highlighting structural challenges in downstream operations. Moreover, escalating exploration and production costs amidst geopolitical tensions and supply chain disruptions have limited the sector’s ability to sustain margins, signaling margin pressure that is expected to persist in the near term.
Communication Services Sector’s Margin Pressure: Underlying Drivers and Impact
The communication services sector experienced marked margin contraction in Q1 2026, with net profit margins falling from 16% in the prior year to approximately 13.7%. This decline erodes a previously robust margin base which outperformed the S&P 500 average, signaling emerging profitability headwinds despite ongoing revenue growth in sub-industries like interactive media and wireless telecommunications.
Margin compression in this sector is principally driven by intensified infrastructure investments required for network upgrades, including the deployment of advanced 5G technologies and cloud capabilities, which have increased operating expenses. Additionally, aggressive promotional pricing, competitive discounting, and the steady erosion of legacy services such as linear television have weighed heavily on profitability. Currency fluctuations and pricing competition in global markets have further exacerbated cost pressures, particularly for firms with significant international exposure. These factors collectively temper margin outlooks and highlight the transitional nature of the sector amid rapid technological evolution.
Having established the pronounced sectoral margin differentials between technology’s commanding expansions and the considerable challenges facing energy and communication services, the report proceeds to assess margin dynamics in additional sectors such as utilities and industrials, where structural factors modulate their profitability trajectories.
Utilities and Industrials: Modest Margin Improvements Confront Structural Constraints
This subsection examines the nuanced margin performance within traditionally challenged sectors—utilities and industrials—highlighting modest improvements amid persistent structural headwinds. By quantifying margin progress and dissecting limiting factors, it elucidates the operational and market dynamics shaping profitability evolution in these sectors for Q1 2026, thereby contextualizing broader sectoral disparities discussed in the margin analysis section.
Extent of Utilities Sector Margin Improvement in Q1 2026
The utilities sector demonstrated notable progress in profitability during the first quarter of 2026, with net profit margins advancing significantly compared to the prior quarter. Analytical data indicates a quarter-over-quarter increase from approximately 12.1% to 15.1%, a substantial uptick that signals strong operational discipline and effective cost management. This margin expansion is particularly meaningful given the traditionally capital-intensive nature of utilities and the regulatory constraints governing the sector, which often limit pricing flexibility and margin growth potential.
This improvement also reflects tactical responses to inflationary pressures and energy market volatility, enabling select utilities to leverage regulatory rate adjustments and optimize operational efficiencies. Importantly, the sector’s margin level now exceeds its recent historical benchmarks, underscoring resilience despite ongoing macroeconomic uncertainties. The upward margin trajectory suggests that utilities companies are increasingly able to translate steady revenue streams into higher earnings quality, positioning the sector as a relative outperformer in profitability metrics within the broader equities landscape.
Detailed Margin Dynamics in the Industrial Products Sector
The industrial products sector exhibited a more mixed margin performance in Q1 2026. While revenues posted a healthy year-over-year increase exceeding 10%, underlying margin contraction of approximately 1% was reported, marking a sequential decline from the prior quarter’s margin level. This indicates that, despite favorable top-line growth driven by manufacturing recovery and strong demand conditions, cost inflation and supply chain bottlenecks exerted downward pressure on profitability.
Cost structure challenges, including rising raw material expenses and labor inflation, alongside persistent logistical inefficiencies, constrained margin expansion. Notably, the industry’s gross margins remained squeezed due to elevated input costs and competitive pricing environments. Further compounding pressures, ongoing supply chain disruptions limited operational leverage, restricting companies’ ability to fully pass rising costs to customers. These factors, combined with cautious pricing strategies, ultimately resulted in a contraction of profit margins amid robust sales growth.
Despite these challenges, selected industrial firms displayed differentiated performance by adopting targeted cost control measures and operational improvements. This heterogeneity within the sector points to potential margin inflection opportunities contingent upon supply chain normalization and further operational discipline.
Structural Challenges Limiting Deeper Margin Gains in Utilities and Industrials
The margin trajectories observed in both utilities and industrials are fundamentally shaped by enduring structural constraints. For utilities, regulated pricing frameworks and required capital investments limit rapid margin expansion, while inflationary input costs continue pressuring expense baselines. Furthermore, regulatory lag in rate adjustments can delay margin realization, requiring firms to maintain operational efficiency as the primary lever for profitability enhancement.
In the industrial sector, the convergence of supply chain disruptions, material cost inflation, and competitive end markets generates a complex margin management environment. Volatility in raw material pricing, particularly metals and energy inputs, introduces earnings variability, while labor costs continue to escalate due to tight labor markets. Additionally, competitive dynamics in industrial products often inhibit significant price increases, resulting in compressed margins even amid volume growth.
These structural impediments underscore the limited scope for immediate margin expansion despite favorable revenue conditions. Companies within these sectors are therefore compelled to pursue incremental operational improvements, technological adoption, and supply chain resiliency enhancements to sustainably support profit margins over the medium term.
Understanding the marginal gains achieved in utilities and the margin pressures faced in industrials lays the foundation for contrasting these sectors with technology and energy, where divergent margin trajectories reflect distinct operational and market dynamics. The following analysis will delve deeper into sectoral margin contrasts, illustrating how margin evolution is shaped by both strategic execution and structural factors.
5. Operational Discipline and Strategic Capital Allocation
Operational Efficiency: Driving Margin Expansion Through Rigorous Execution and Strategic Restructuring
This subsection analyzes the tangible impact of disciplined operational management on margin expansion during Q1 2026, focusing on illustrative corporate case studies and sector-level margin dynamics. Its purpose is to provide decision-makers with granular insights into how systematic cost controls, restructuring efforts, and efficiency initiatives concretely reinforced profitability amid prevailing economic and supply chain challenges.
Genuine Parts Company’s EBITDA Margin Surge Fueled by Scale and Strategic Pricing
Genuine Parts Company delivered a significant improvement in EBITDA margins in the first quarter of 2026, registering an expansion of 90 basis points within its Global Industrial segment. This uplift reflected successful execution of strategic pricing policies and sourcing optimizations, which leveraged the company’s extensive scale and diverse end-market exposure across 10 of 14 tracked sectors. The operational resilience was underscored by a 5.5% comparable sales increase in North America Automotive company-owned stores, validating the effectiveness of initiatives focused on internal operational optimization complemented by robust external franchise relationships. Despite pronounced inflationary pressures and geopolitical-induced supply chain disruptions, such as those linked to ongoing Middle East conflicts, management’s adherence to established operational playbooks enabled proactive margin protection and market share gains. This disciplined execution not only generated sequential improvements across key operational metrics but also positioned the company well to maintain its full-year guidance amidst projected volatility.
From a strategic perspective, Genuine Parts amalgamated market intelligence with operational discipline, adapting quickly to sector-specific challenges such as fuel-related headwinds in Asia-Pacific and logistical constraints globally. This nimble approach facilitated inventory and cost control efficiencies, which were integral contributors to margin expansion. Furthermore, their ability to capture market share during periods of economic uncertainty signals a competitive moat reinforced by operational rigor and pricing power.
Smithfield Foods’ Restructuring and Vertical Integration Boost Operating Profitability
Smithfield Foods exemplified operational discipline through targeted restructuring and strategic right-sizing of its vertically integrated hog production chain, which formed a critical pillar in achieving record first quarter adjusted operating profits of $339 million. Key factors underpinning this performance included a 40% reduction in internally produced hogs, closure of underperforming farms, and advancements in genetics and nutrition, collectively driving cost efficiencies and enhanced productivity in the hog production segment. The vertical integration model afforded Smithfield pricing flexibility and resilience by enabling earnings migration across related segments and ensuring raw material continuity for their higher-margin packaged meats business.
Operational excellence was further pursued through a comprehensive program that achieved an 11% reduction in corporate expenses and manufacturing cost optimizations. This translated into improved profitability despite headwinds such as rising energy and packaging-related input costs driven by geopolitical volatility. A deliberate strategic pivot towards premium, value-added meat products expanded purchase occasions and unit velocity, thereby supporting margin sustainability. The company’s ability to maintain and increase market share in 20 out of 25 retail subcategories demonstrates successful brand positioning enabled by disciplined operational execution. These restructuring efforts not only enhanced cost structures but also underpinned a culture of continuous improvement, reinforcing Smithfield’s competitive advantage in a challenging macroeconomic environment.
Industrial Sector Margin Trends: Mixed Performance Amid Supply Chain and Cost Pressures
The Industrial Products sector posted a modest margin contraction in Q1 2026, declining by approximately 1%, even as revenues surged by over 10% year-over-year. This divergence underscores the sector’s ongoing battle with rising input costs and persistent supply chain bottlenecks despite sustaining strong demand, particularly in manufacturing and e-commerce-related activities. Profit growth within industrial firms was supported by macroeconomic tailwinds and proactive policies, yet margin compression highlights structural cost headwinds that companies continue to address through operational streamlining and supply chain optimization.
Notwithstanding common pressures, certain subsectors demonstrated notable operational improvements that partially offset margin erosions. Cutting-edge equipment manufacturing, a driver behind China’s robust industrial profit growth, reported double-digit profitability increases, signaling pockets of operational excellence within the broader industrial landscape. The sector’s dynamic thus presents a nuanced picture: while top-line growth momentum remains solid, elevated costs and inflationary impacts persistently test margin sustainability, placing a premium on disciplined operational management and innovation-driven efficiencies.
Having established the tangible role of operational discipline and restructuring in margin expansion, the subsequent subsection will explore how these efficiency gains complement forward-looking capital allocation strategies, reinforcing sustainable competitive advantage.
Forward-Looking Capital Deployment: Balancing Growth Potential with Strategic Discipline
This subsection investigates how leading corporations are steering capital deployment amid evolving market dynamics in Q1 2026. By dissecting the forward-looking financial guidance and capital management tactics of major firms across automotive, energy, and banking sectors, we uncover the mechanisms through which strategic capital allocation underpins sustainable competitive advantage and operational resilience.
Ford Motor Company’s Raised EBIT Guidance Reflecting Strategic Operational Recovery and Innovation Focus
Ford Motor’s Q1 2026 financial results illustrate a robust capital deployment strategy anchored in operational recovery and growth-oriented innovation. The company reported revenue of $43.3 billion alongside an adjusted EBIT of $3.5 billion, although exclusion of a one-time $1.3 billion tariff reversal adjusts this figure to $2.2 billion, signaling underlying operational strength amid margin pressure. The subsequent upward revision of full-year adjusted EBIT guidance to a $8.5–$10.5 billion range underscores confidence in the company’s strategic initiatives, particularly within high-margin software and service lines, which are expanding alongside core automotive segments.
This guidance upgrade is notably supported by Ford’s anticipation of a $1 billion year-over-year EBIT improvement tied to the restart of the Novelis hot mill, reflecting targeted supply chain normalization. Despite headwinds from elevated commodity costs — specifically aluminum and steel — Ford’s capital expenditure is projected between $9.5 billion and $10.5 billion for 2026, demonstrating disciplined investment focused on balancing near-term cost containment with long-term technology advancement in electric and software-enabled vehicles. The staggered recovery in the F-150 and Super Duty lineup production capacity further exemplifies calibrated capital allocation designed to revitalize flagship revenue generators while managing volatility in raw material pricing.
Chevron’s Integration-Driven Capital Strategy Delivering Refinery Throughput Expansion and Margin Capture
Chevron’s first-quarter 2026 operational narrative reveals a capital deployment strategy that leverages upstream and downstream integration to optimize production efficiency and margin expansion. The company reported sustained upstream production exceeding 2 million barrels of oil equivalent per day within the U.S., complemented by 1 million barrels per day from key projects such as Tengizchevroil. Additionally, Chevron’s refineries reached record crude throughput levels, propelled by their complex refining configurations and a diversified portfolio of feedstocks originating from multiple global basins including Guyana, Permian, Venezuela, and Argentina.
The strategic emphasis on integration enables Chevron to capture value across the entire supply chain, maximizing margin potential from intermediate products such as fuel oil and sulfur amid volatile price environments. Consistent refinery utilization rates greater than 80% in Asia reinforce the company’s operational resilience and capacity to adapt dynamically to shifting market demand. Capital discipline remains pivotal, with a focus on maintaining strong cash flow, cost containment, and shareholder returns, underpinning the company’s balanced approach to sustaining growth while managing geopolitical and macroeconomic uncertainties.
Rockland Bank’s Prudent Capital Management Supporting Stable Growth and Robust Financial Metrics
Rockland Bank exemplifies disciplined capital allocation within the financial services sector, showcasing a strategy that prioritizes balance sheet strength and sustainable growth. The bank reported net income of approximately $80 million for Q1 2026, representing steady profitability alongside maintaining key performance indicators such as a return on average assets exceeding 1.3% and a return on average tangible common equity above 13%.
Strategically, Rockland focuses on a relationship-driven commercial lending model supported by localized market knowledge and a diversified, low-cost deposit base. This model is enhanced by scalable wealth management fee income and an efficient cost structure emphasizing operating leverage. Capital adequacy and liquidity buffers remain robust, reinforced by prudent interest rate and liquidity risk management frameworks. Acquisitions that add density within core markets reflect a measured approach to growth, ensuring that capital deployment aligns with the bank’s risk appetite and returns thresholds.
Building upon the analysis of forward-looking capital deployment across key sectors, subsequent sections will delve into the operational drivers behind margin expansion and strategic execution, thereby linking capital allocation decisions with realized profitability and competitive positioning.
Strategic Investment Activity: Market Confidence in Innovation
This subsection dissects how targeted capital allocation patterns, particularly within the semiconductor and technology sectors, directly reflect growing market confidence in innovation-driven growth. Integrating insights on institutional investment flows and ETF dynamics, the analysis highlights how strategic positioning by key players and broader investor behavior synergize to reinforce a positive feedback loop underpinning Q1 2026's robust earnings environment.
Focused Capital Flows Toward Semiconductor Innovation by Palisades Investment Partners
In Q1 2026, Palisades Investment Partners distinctly prioritized semiconductor firms exhibiting cutting-edge technological advancements and scalable growth potential. This targeted reallocation underscores a strategic recognition of the semiconductor industry's pivotal role in the AI and data center infrastructure boom. By channeling resources into top-tier semiconductor stocks and select technology innovators, Palisades demonstrates a conviction aligned with sustained demand increases amid constrained supply dynamics. This tactical positioning not only leverages ongoing secular growth trends but also mitigates exposure to sectors showing decelerating momentum, thereby maximizing portfolio resilience amid economic uncertainty.
Palisades’ capital emphasis specifically on memory and logic chip manufacturers, as well as equipment suppliers critical to advanced nodes, reflects a nuanced understanding of industry sub-segments where innovation directly translates into competitive advantage and pricing power. Such focus is corroborated by the firm’s increased weighting in companies leading next-generation semiconductor manufacturing technologies, reinforcing their strategic posture to capture disproportionate returns from AI-driven infrastructure investments.
ETF Inflows and Sectoral Investment Trends Q1 2026: Scale and Market Sentiment
The global ETF landscape during Q1 2026 showcased record net inflows, with actively managed and thematic ETFs spearheading investor enthusiasm. Notably, technology-themed ETFs, including those with semiconductor sector focus, experienced significant asset growth, signifying broad market endorsement of innovation-centric growth themes. Despite intermittent headwinds in large-cap index funds, thematic vehicles capturing AI, robotics, and autonomous technologies recorded material capital accumulation, indicating a shift towards tactical exposure in high-conviction areas.
ETF inflows reflected a nuanced investor appetite gravitating towards sectors that combine growth with innovation leadership. For example, ETFs aligned with advanced memory, semiconductor fabrication, and AI infrastructure components collectively witnessed robust inflows, even as the broader equity market faced volatility. This divergence implies investor segmentation favoring high-tech growth pockets amid macroeconomic uncertainties, reinforcing the role of ETFs as efficient conduits for deploying capital into leading-edge industry segments.
Capital Allocation Trends Correlated with Investor Confidence and Forward Momentum
The observed concentration of capital in semiconductor innovation manifests broader investor confidence tethered to expected durable demand drivers, such as hyperscale cloud expansion and AI compute requirements. This confidence is further entrenched by the convergence of strategic capital deployment among corporate leaders and their financial backers, signaling that operational priorities and investment philosophies are tightly aligned towards innovation excellence.
Moreover, investor sentiment indicators, such as positive guidance issuance and increasing beat rates among key technology firms, underpin this capital inflow environment. Strategic capital allocation backed by empirical operational results creates a reinforcing cycle, where investment flows both fund and validate innovation trajectories. In essence, market confidence in innovation operates as a self-reinforcing mechanism, elevating valuations and capital access for firms at the forefront of technological advancement.
Building on the detailed examination of strategic investment activity and market confidence, the report next explores how these capital flows concretely translate into operational discipline and margin expansion, completing the narrative linking investment to earnings resilience.
Overall Sector and Market Margin Context
To contextualize the operational and capital allocation strategies discussed, it is instructive to consider broader market margin trends that frame the competitive environment in Q1 2026.
S&P 500 Net Profit Margin Trends Indicating Resilient Earnings Environment
Across the broader market, the S&P 500 net profit margin has shown consistent improvement over the past six quarters, culminating in a record high of 13.4% in Q1 2026. This steady upward trajectory reflects a resilient earnings environment underpinned by disciplined cost management and strategic pricing across multiple sectors. The margin expansion trajectory aligns with the operational excellence and capital deployment discipline illustrated in the corporate case studies, underscoring the efficacy of proactive management amid ongoing macroeconomic uncertainties.
This broader market context reinforces the fundamental importance of operational and capital discipline in driving sustainable profitability, as will be further explored in the ensuing sections.
6. Stress Testing Organizational Resilience: Forward Guidance and Risk Navigation
Guidance Visibility Gaps: Strategic Communication in Uncertain Times
This subsection examines the challenges companies face in maintaining transparent and timely forward guidance during periods of heightened uncertainty, with a focus on the energy and airline sectors. As geopolitical tensions and market volatilities disrupt forecasting accuracy, this analysis highlights how guidance issuance patterns affect investor confidence and strategic decision-making, underscoring the critical role of communication clarity in sustaining organizational resilience.
Quantifying Energy Sector Guidance Delays and Their Strategic Impact in Early 2026
The energy sector in Q1 2026 exhibited a pronounced hesitancy in issuing forward guidance, driven principally by volatile commodity prices and ongoing geopolitical uncertainties impacting supply chains and policy environments. Approximately half of major energy firms delayed or withdrew detailed projections for upcoming quarters, reflecting widespread caution stemming from regulatory unpredictability and market access constraints.
These delays carry measurable strategic consequences; the absence of clear guidance complicates capital allocation decisions for investors and operational planning within firms. Prolonged visibility gaps reduce the ability to signal confidence in future cash flows, potentially elevating the cost of capital and diminishing market valuations despite underlying operational improvements. Consequently, the energy sector’s strategic resilience is increasingly tied to enhanced scenario planning and alternative communication mechanisms beyond traditional guidance frameworks.
Assessing Airline Sector Forward Guidance Issuance Rates Amidst Fuel Price Volatility
Airlines, a sector acutely sensitive to fuel cost fluctuations and geopolitical events impacting travel demand, showed a mixed pattern in guidance issuance during the first quarter of 2026. While some full-service carriers maintained cautious forward outlooks emphasizing fuel price uncertainty, a notable portion of low-cost and ultra-low-cost carriers either refrained from issuing specific quarterly forecasts or significantly widened their forecast ranges.
The relatively lower frequency and specificity of guidance issuance within the airline sector can be attributed to the persistent volatility of jet fuel prices and uncertain consumer travel patterns influenced by geopolitical developments. This guidance ‘ghosting’ reduces transparency, complicating stakeholder assessments of strategic positioning and risk management effectiveness. Notably, companies that provided alternative narrative disclosures or scenario-based frameworks aided market participants in better contextualizing risks despite traditional guidance gaps.
Linking Geopolitical Event Timing with Forward Guidance Withdrawal Patterns
A clear correlation emerges between acute geopolitical shocks and increased frequency of forward guidance withdrawal or vagueness during Q1 2026. Events such as heightened Middle East tensions and tariff uncertainties have led multiple companies across capital-intensive sectors to adopt a 'wait-and-see' posture regarding detailed forecasts, reflecting the strategic prudence of avoiding fixation on potentially obsolete assumptions.
This behavior underscores a fundamental tension in corporate communications: balancing the need to provide investors with clarity against the risk of misguiding amidst an unpredictable environment. The timing of withdrawals tends to cluster shortly after major geopolitical announcements, indicating reactive rather than proactive guidance strategies. Firms increasingly rely on adaptive communication tools, emphasizing operating performance narratives and qualitative insights over precise quantitative forecasts to maintain credibility and investor trust during turbulent periods.
Having assessed the dynamics and consequences of guidance visibility gaps amid complex geopolitical and market conditions, the report now turns to analyze how broader macroeconomic and geopolitical pressures unevenly affect corporate resilience across sectors, shaping strategic risk profiles and operational adaptability.
Geopolitical and Macroeconomic Pressures: Unveiling Sectoral Vulnerabilities and Earnings Impact
This subsection delves into the critical influence of geopolitical tensions, specifically the Middle East conflict, alongside prevailing macroeconomic constraints such as Federal Reserve policy tightening, on the differential performance of sectors in Q1 2026. By quantifying these influences, it elucidates how external shocks have shaped earnings outcomes, cost structures, and profitability variations across industries. This analysis is essential to understand sector-specific exposure and to inform resilient strategic positioning amid ongoing uncertainties.
Quantifying the Middle East Conflict's Direct Impact on Sector Earnings in Q1 2026
The Middle East conflict that escalated in late February 2026 precipitated a pronounced surge in energy prices and operational disruptions that reverberated across global corporate earnings. Energy sector performance reflected this complexity: while aggregate earnings initially faced downward pressure due to supply chain interruptions and increased operating costs, elevated commodity prices ultimately buoyed revenues and valuations, particularly for integrated players who leveraged refined throughput optimization and strategic asset management. For instance, major oil producers reported production increases exceeding half a million barrels per day year-over-year in the U.S., accompanied by aggressive margin capture activities in Asian refineries, underscoring a tactical shift toward enhanced value-chain integration during the crisis period.
Beyond energy, the conflict imposed varied material impacts on other sectors. Multinational travel and consumer discretionary businesses, such as global hospitality platforms, estimated a 2% reduction in room night growth attributable to conflict-driven demand softness. The airline industry faced acute fuel cost pressures, validating the strategic value of prior hedging programs; carriers with comprehensive fuel risk mitigation mechanisms demonstrated resilience, whereas those less hedged encountered heightened cost volatility. Industrial equipment providers experienced sequential revenue declines linked both to direct disruption in supply chains and elevated input costs tied to energy and freight dependencies. The contrasting performance highlights pronounced heterogeneity in conflict vulnerability, necessitating granular risk assessments by corporate leaders.
Measuring Federal Reserve Policy Constraints on Sector Profitability in Q1 2026
Monetary policy tightening by the Federal Reserve maintained a restrictive stance into Q1 2026, exerting constraining effects on liquidity, credit availability, and corporate financing costs. Sectors reliant on leveraged expansion or sensitive to borrowing rates, such as real estate, utilities, and certain financial subsectors, exhibited earnings headwinds due to compressed net interest margins and cautious loan growth. Despite these pressures, top-tier financial institutions with diversified operations and digital advancements reported earnings rebounds, reflecting operational adaptability.
The persistent Fed policy stance induced investor recalibrations, favoring companies exhibiting robust internal cash flows and conservative capital structures. Elevated interest rates rendered costly capital more restrictive, thereby shaping corporate investment priorities and slowing discretionary spending in economically sensitive sectors. Additionally, sectors with significant import exposure faced amplified margin squeeze due to currency fluctuations impacted by global capital flow adjustments tied to Fed rate decisions. This dynamic underscored the necessity for firms to enhance financial discipline and hedge macro-financial exposures effectively.
Estimating Sector-Specific Cost Pressure Variations to Aid Strategic Risk Navigation
Cost pressures in Q1 2026 varied significantly across sectors as a result of energy price surges, inflation persistence, and supply chain disruptions amplified by geopolitical tensions. Energy-intensive industries such as chemical manufacturing and heavy industrials contended with markedly higher input costs, compressing operating margins despite revenue growth in some cases. Consumer goods companies faced elevated expenses across packaging, logistics, and raw materials, exacerbated by energy-driven inflation and tariff-related complications.
The luxury goods sector exemplified this trend, with firms reporting localized sales softness in the Middle East region and increased costs for energy and packaging materials like glass. Meanwhile, transportation and freight-dependent sectors confronted amplified cost increases due to rising fuel prices and limited capacity in shipping corridors affected by regional instability. Conversely, technology and finance sectors experienced relatively muted direct cost inflation, benefiting from lower physical supply chain reliance and increased operational digitization. This sectoral disparity in cost burden necessitates differentiated margin management strategies and proactive supply chain diversification to mitigate sustained earnings volatility.
The combined effects of geopolitical disruption and monetary tightening underscore the multifaceted challenges confronting corporate earnings in Q1 2026. Understanding these differentiated sector exposures is foundational to advancing the broader analysis of forward guidance uncertainties and organizational resilience in the subsequent subsection.
Currency Fluctuations and Supply Chain Challenges: Hidden Vulnerabilities Impacting Multinational Margins and Resilience
This subsection examines how Q1 2026 foreign currency translation losses and pervasive supply chain disruptions have imposed hidden stresses on multinational corporations’ earnings and operational efficiency. It contextualizes these headwinds within the broader framework of sectoral performance disparities and strategic hedging effectiveness, thereby illuminating key vulnerabilities that shape organizational resilience in an increasingly volatile global environment.
Quantifying Q1 2026 Foreign Exchange Translation Losses by Sector
The first quarter of 2026 saw significant currency translation challenges for multinational corporations, with notable adverse impacts concentrated in sectors highly exposed to USD, EUR, and emerging market currency volatility. For example, companies within the automotive and technology sectors recorded sizable revenue translation setbacks — Straumann reported losses approximating $53 million attributable to USD and EUR depreciation, while Melexis experienced a 4% sales impact due to euro-dollar exchange rate movements. These translation losses are multifaceted, reflecting intricate interplay between changes in average exchange rates and geographic revenue mixes. Financial institutions similarly disclosed downward earnings pressure, with one major Canadian bank reporting a $91 million net income decline stemming from currency movements, primarily reflecting USD/CAD exchange rate shifts. Across these sectors, consolidated financial statements indicate underlying revenue and earnings declines averaging between 1% to 3%, underscoring the persistent challenge of managing FX translation risk amid uneven currency trajectories.
Sectoral variance in exposure to foreign exchange impacts reveals differentiated risk profiles. Consumer discretionary and telecommunications firms, with greater global supply chain footprints and client mixes, faced relatively higher earnings sensitivity due to currency corridors displaying elevated volatility, whereas domestic-oriented sectors or those with localized revenue streams experienced more muted FX translation effects. This heterogeneity necessitates nuanced sector-level risk management approaches and underpins divergent financial outcomes observed during the quarter.
Assessing Supply Chain Disruption Effects on Multinational Margins and Operational Costs
Beyond currency translation headwinds, supply chain disruptions remain a persistent drag on multinational corporations’ margin expansions and operational efficiency. Despite some sectoral improvements, particularly in industrial products benefiting from manufacturing recovery and e-commerce growth, supply chain bottlenecks and inflationary cost pressures constrained overall margin performance in Q1 2026. The industrial sector evidenced a 1% margin decline year-over-year, reflecting higher input prices, logistic delays, and supplier risk management challenges. These operational impediments translated into increased costs, shipment lead-time variabilities, and inventory management complexities.
Global supply chain vulnerabilities extend beyond cost impacts to threaten delivery reliability and customer satisfaction, with cascading effects on brand reputation and financial forecasts. Studies highlight that multinational firms have increasingly adopted diversified supplier bases, multi-sourcing strategies, and technology-driven supply chain visibility enhancements to mitigate such disruptions. However, such resilience-building often incurs trade-offs, including elevated working capital requirements due to inventory buffers and potential cost inefficiencies. Furthermore, geopolitical tensions and tariff uncertainties exacerbate supply chain complexity, compelling companies to recalibrate sourcing strategies and logistics networks continually.
Evaluating the Effectiveness of Hedging Strategies in Mitigating FX Risks During Q1 2026
In response to pronounced foreign exchange volatility, numerous multinationals have intensified the deployment of dynamic hedging strategies to manage currency risk and stabilize reported results. Hedging instruments, including forward contracts, currency swaps, and options-based strategies, have been employed with varying success in buffering income statement exposures. For instance, firms from the pharmaceutical and healthcare sectors reported net positive operating income impacts quantified in the tens of millions due to effective hedging of currency exposures, partially offsetting adverse translation effects on top-line revenues.
Hedging effectiveness in Q1 2026 was bolstered by the integration of real-time scenario analysis, delta hedging adjustments, and option collars that collectively enhanced portfolio resilience against unpredictable currency moves. Nonetheless, the complex multi-currency environment and the interaction with commodity price volatility — particularly relevant for energy and industrial companies — demand continuous recalibration of hedging tactics. While hedging mitigates earnings volatility, it cannot fully eliminate underlying economic exposures, especially where currency movements coincide with structural market shifts or supply chain shocks.
Having detailed the quantifiable impacts of currency fluctuations and supply chain disruptions on multinational margins and operational resilience, the report next investigates how organizations strategically navigate these macroeconomic headwinds through forward guidance transparency and risk mitigation frameworks. It is notable that despite these pervasive external pressures, corporate earnings robustness was reflected in the overall market results, with Q1 2026 earnings beat rates reaching 84%, surpassing the 5-year average of 78% and the 10-year average of 76%, underscoring resilient performance through effective risk navigation [Chart: Earnings Beats vs. Historical Averages].
7. Valuation Sentiment and Forward-Looking Indicators
Margin Durability Over Top-Line Growth: Aligning Valuation with Profitability Trends
This subsection investigates the evolving investor preference shifting away from pure top-line expansion toward sustained margin durability as a critical determinant of valuation. By quantifying changes in forward price-to-earnings ratios alongside detailed sectoral margin trends for Q1 2026, it contextualizes how profitability resilience is reshaping market expectations and strategic focus. This analysis provides decision-makers with a nuanced understanding of the fundamental drivers behind equity valuations in a complex macroeconomic environment.
Forward P/E Ratio Expansion Reflecting Elevating Profitability Expectations
The S&P 500 forward price-to-earnings ratio for Q1 2026 stands elevated at approximately 22.2x, significantly above long-term historical averages spanning the previous 15 years. This multiple expansion reflects heightened market confidence in earnings durability amid an uncertain geopolitical backdrop. Notably, the highest P/E ratios correspond with mega-cap technology leaders whose projected earnings growth and margin expansion continue to underpin elevated valuations, despite broader market volatility.
This premium valuation environment underscores investor willingness to pay for quality earnings and margin stability rather than relying solely on revenue growth as a valuation metric. The forward P/E increase also indicates an underlying market narrative that profits sustained through operational efficiency and pricing power are now paramount, with investors discounting transient growth episodes that lack margin support.
Sectoral Margin Trends Confirm Margin Resilience across Leading Industries
Q1 2026 net profit margins for the S&P 500 reached an all-time high of 13.4%, the highest level recorded in over a decade. This achievement is led predominantly by the information technology sector, which reported margins exceeding 29%, well above its five-year average, exemplifying exceptional profitability and operational leverage.
While technology and financial sectors showcase robust margin expansion, the landscape remains heterogeneous. Communication services and energy sectors faced margin contraction year-over-year, with energy notably below its five-year margin average due to cost pressures and geopolitical uncertainties influencing commodity prices.
Other sectors such as utilities experienced modest margin improvements quarter-over-quarter, signaling gradual structural stabilization despite external challenges. These divergent margin dynamics reinforce the notion that margin durability—and its sustainability relative to historical norms—is a key determinant of sectoral attractiveness to investors in the current market cycle. The elevated analyst revisions for technology at 25%, versus 9% for energy and 5% for financials, further corroborate the sector’s strong market sentiment and confidence in sustained profit growth.
Sector-specific analyst revisions indicating market sentiment.
Having established the primacy of margin durability in guiding valuation shifts and identified sector-level margin performance disparities, the analysis now transitions to exploring the strategic factors enabling operational discipline and capital allocation decisions that underpin these profitability trends.
Positive Guidance and Beat Rate Synergy: Confirming Fundamental Strength
This subsection explores the quantitative relationship between the issuance of positive earnings guidance by corporations and the observed earnings beat rates in the first quarter of 2026. By examining this linkage, it highlights how forward-looking corporate communications reinforce underlying earnings quality and validate the resilience demonstrated in reported results. This analysis supports strategic decision-making by underlining the credibility and sustainability of current profit trends across sectors.
Correlation Between Positive Earnings Guidance and Earnings Beat Rates in Q1 2026
During the first quarter of 2026, a notable majority of companies issuing quarterly earnings guidance adopted an optimistic stance, with approximately 54% providing positive EPS guidance—significantly surpassing the five- and ten-year historical averages of around 40% to 42%. This elevated level of positive guidance issuance indicates heightened managerial confidence in outperforming consensus forecasts, a marked shift compared to prior periods characterized by greater caution due to macroeconomic and geopolitical uncertainties.
Concurrently, earnings beat rates within the S&P 500 have remained robust, with about 84% of firms reporting actual EPS above estimates. This beat rate exceeds the five-year average of 78%, underscoring the strong quality of reported earnings results. The high concurrency of positive guidance with these beat rates reflects a reinforcing dynamic where managements’ forward-looking optimism aligns closely with realized financial performance, lending credibility to the upward revisions in market expectations observed throughout the quarter.
The Information Technology sector exemplifies this synergy, registering the highest number of companies issuing positive guidance combined with the leading EPS beat rates among all sectors. This sector’s pronounced issuance of upbeat guidance, particularly in semiconductor and related subindustries, has materially contributed to the elevated aggregate earnings growth and reinforced investor confidence. In contrast, sectors issuing fewer positive guidance statements tended to exhibit relatively muted beat rates, indicating that guidance issuance can be a useful proxy for assessing sectoral earnings momentum.
Overall, these data points confirm that the issuance of positive earnings guidance serves as a reliable signal of fundamental earnings strength and strategic execution effectiveness in Q1 2026. For investors and strategic planners, this correlation supports an increased weighting of forward guidance metrics when assessing earnings quality and projecting future corporate performance.
Impact of Earnings Surprises on Subsequent Guidance Revisions and Market Interpretation
Earnings surprises reported in Q1 2026 have demonstrably influenced subsequent corporate guidance trajectories, with a statistically significant bias toward upward revisions. Research indicates that initial guidance commonly remains stable after it is issued; however, over the course of the fiscal year, companies tend to revise earnings expectations progressively upward more frequently than downward. This pattern intensifies following quarters with earnings beats where positive surprises validate or exceed prior forecasts.
The tendency for companies to raise guidance following an earnings beat reflects a strategic approach to capitalize on demonstrated operational momentum and manage investor expectations proactively. Notably, guidance revisions are more likely to occur when the prior guidance underestimated underlying business conditions or failed to capture favorable trends in revenue growth and margin expansion. Consequently, earnings beats act as a catalytic mechanism for improving the forward outlook, which in turn bolsters market sentiment and valuation multiples.
Analyses of market responses reveal that stock prices respond most positively when companies both raise guidance and beat earnings estimates simultaneously. Conversely, instances where firms beat earnings but issue lower or cautious forward guidance tend to temper positive market reactions. This underscores the primacy of credible, forward-looking communications in validating firm performance beyond historical accomplishments.
For strategic leaders and investors, understanding this interplay emphasizes the need to monitor quarterly earnings not only for quantifiable beat metrics but also for qualitative shifts in guidance. The combination of strong reported results with positive guidance revisions offers enhanced visibility into sustainable earnings trajectories and operational discipline.
Building on the demonstrated alignment between earnings beats and positive guidance, the subsequent section will explore how these fundamental performance signals interact with evolving investor sentiment and valuation patterns to influence strategic capital allocation decisions and portfolio positioning.
8. Conclusion and Strategic Imperatives
Synthesizing Performance and Strategy: Lessons for Durable Organizational Resilience
This subsection integrates empirical evidence and strategic insights from Q1 2026 corporate earnings to elucidate how sustained margin durability and deliberate strategic execution underpin organizational resilience. Drawing on quantitative benchmarks and firm-level examples, the analysis demonstrates how disciplined management practices translate into robust earnings growth and competitive advantage, forming a vital foundation for resilient corporate performance amid evolving macroeconomic challenges.
Exceeding Margin Durability Benchmarks: Quantitative Evidence of Earnings Resilience
During the first quarter of 2026, numerous sectors exhibited net profit margins exceeding 10%, a quantitative threshold widely regarded as indicative of durable earnings quality. Evidence from market-leading technology and semiconductor firms showed operating margins reaching up to 70-80%, substantially outpacing broader market averages and underscoring the extraordinary profitability achievable through structural cost advantages and pricing power. These elevated margins are not transient phenomena but rather the outcome of sustained operational discipline, enabling firms to withstand economic headwinds while maintaining cash flow generation strength essential for reinvestment and shareholder returns.
Moreover, this surpassing of margin durability benchmarks extends beyond niche technology leaders. Companies across energy, financials, and consumer discretionary sectors demonstrated notable margin improvements driven by efficient cost structures, strategic pricing, and selective capital deployment. This margin strength has been a critical factor enabling these firms to maintain growth trajectories during a period marked by inflationary pressures and geopolitical uncertainty. The persistence of such margin profiles suggests a redefined baseline for earnings resilience that investment decision-makers must incorporate into their valuation frameworks. Analyst projections further support this trend, with net profit margins expected to expand from 14.1% in Q2 2026 to 14.6% by Q4 2026, indicating sustained confidence in margin durability across sectors [Chart: Projected Net Profit Margins for 2026].
Firm-Level Cases Linking Strategic Execution to Resilience and Growth
Concrete examples illustrate the powerful link between strategic execution and organizational resilience. Genuine Parts Company’s systematic focus on operational efficiency fostered robust EBITDA growth, which complemented its strategic emphasis on supply chain agility and customer service excellence. Similarly, Smithfield Foods’ targeted restructuring initiatives enhanced cost discipline and margin expansion, reinforcing its earnings stability despite sector-wide input cost volatility.
In the technology sector, leaders such as SK hynix adopted aggressive bonus reserve policies aligned with robust profitability, simultaneously sustaining high operating margins and shareholder returns. These cases exemplify how strategic clarity in resource allocation and operational rigor enable firms not only to preserve earnings quality but also to capitalize on growth opportunities amidst heightened market volatility. The clear strategic narratives behind these performances disprove the ad hoc tactical responses frequently seen in less resilient peers, highlighting the premium value associated with disciplined strategy execution.
Strategic Execution’s Impact on Earnings Growth and Competitive Positioning
Analyses of Q1 2026 earnings reveal that firms adept in executing well-defined strategies outperform peers by delivering consistent earnings growth coupled with margin expansion. This outcome results from a concerted approach that prioritizes capital allocation toward innovation, operational improvements, and market expansion while maintaining strict cost controls. The cohesion between strategy formulation and execution fosters adaptability and resource optimization, enabling companies to navigate external pressures more effectively.
Beyond earnings figures, strategic execution enhances competitive positioning by fostering organizational alignment and agility. Companies that clearly communicate strategic goals, empower decision-making, and integrate performance monitoring mechanisms cultivate resilience that is reflected in their financial outcomes. This synthesis underscores that strategic execution is not merely an administrative process but a dynamic capability essential for sustaining superior earnings growth and for weathering periods of economic uncertainty with minimal erosion of shareholder value.
Having established the quantitative and qualitative foundations of resilience through margin durability and strategic execution, the report will next explore actionable recommendations designed to enhance strategic agility, ensuring companies are better prepared to sustain growth and adapt proactively in an increasingly volatile and complex marketplace.
Recommendations for Enhanced Strategic Agility: Transparent Guidance, Targeted Capital, and Margin Resilience
This subsection distills actionable recommendations derived from the Q1 2026 earnings analyses, focusing on elevating corporate strategic agility through improved forward guidance transparency, alignment of capital allocation with dominant growth drivers, and prioritization of margin durability. By linking empirical evidence and best-practice case studies, it provides decision-makers with concrete levers to accelerate sustainable value creation while navigating ongoing macroeconomic and geopolitical complexities.
Improving Forward Guidance Transparency to Strengthen Investor Trust and Strategic Clarity
In the context of heightened investor scrutiny and volatile market conditions, enhancing the clarity and timeliness of forward guidance emerges as a critical strategic imperative. Best practices observed across leading firms in 2026 underscore the importance of delivering clear, consistent, and comprehensible guidance that balances transparency with prudent risk disclosure. This entails clear communication of underlying assumptions, scenario planning outcomes, and potential operational headwinds, enabling investors and stakeholders to better contextualize current results and forward expectations.
Companies that have integrated structured guidance frameworks—incorporating frequent updates and explanatory qualitative disclosures—have mitigated uncertainty-related valuation volatility. For example, sectors traditionally challenged by guidance visibility gaps, such as energy and airlines, demonstrate that delayed or opaque outlooks can erode investor confidence and complicate capital planning. By adopting standardized communication protocols and leveraging digital reporting tools aligned with evolving regulatory expectations, organizations can enhance credibility and foster sustained capital market engagement.
Aligning Capital Allocation with Top Three Growth Catalysts for Sustainable Competitive Advantage
Strategic capital deployment that directly targets high-potential growth drivers is fundamental to building durable competitive advantage. Current analyses highlight technology innovation, semiconductor industry expansion, and energy sector modernization as the top three catalysts propelling corporate earnings momentum in Q1 2026. Companies exemplifying disciplined investment in these areas not only capture market share but also optimize long-term returns through scalable and innovation-led business models.
The capital allocation strategies of leading firms demonstrate focused reinvestment in research and development, infrastructure modernization, and strategic acquisitions that complement core competencies. For instance, investment approaches that emphasize integrating sustainability considerations with technology upgrades have yielded differentiated cost efficiencies and enhanced brand positioning. Moreover, some market participants reallocate resources dynamically, shifting away from legacy operations toward emergent sectors showing resilient demand. Institutional investors increasingly reward such clarity and focus with elevated confidence and longer-term commitment.
Prioritizing Margin Durability in Strategic Planning to Enhance Earnings Quality and Resilience
Margin durability has surfaced as a paramount strategic priority amid global economic uncertainties, where revenue growth alone proves insufficient for investor satisfaction. Firms that have systematically advanced operational discipline—through cost optimization, streamlined supply chains, and pricing power enhancement—have demonstrated superior earnings quality and resilience against cyclical headwinds.
Evidence from Q1 2026 reveals that companies with deliberate margin-focused strategies consistently outperform in both beat rates and market valuations. These enterprises leverage operational excellence to build pricing flexibility without sacrificing market share, often supported by proactive customer segmentation and value-based selling practices. Initiatives such as targeted restructuring, productivity-enhancing technology adoption, and robust risk management frameworks reinforce margin sustainability. Institutional stakeholders increasingly integrate margin metrics into valuation models, further incentivizing organizational focus on profitability durability over transient top-line expansion.
Collectively, these strategic recommendations highlight an integrated approach where transparent communication, laser-focused capital deployment, and disciplined margin management converge to empower organizations to navigate uncertainty with confidence. The following concluding subsection will synthesize these insights into broader organizational imperatives that emphasize resilience and strategic foresight.
Conclusion
The Q1 2026 earnings season reinforces the notion that sustained double-digit growth is achievable through disciplined strategic execution and sectoral leadership, particularly within technology and semiconductor domains. Record net profit margins at the S&P 500 level, reaching 13.4%, coupled with elevated EPS beat rates, attest to a durability of earnings quality not seen in recent decades. Firm-level exemplars such as Genuine Parts Company and Smithfield Foods demonstrate how operational rigor and targeted restructuring translate into resilient profitability amidst external challenges. The efficacy of capital allocation strategies emphasizing innovation and vertical integration further differentiates high-performing enterprises in this period of heightened uncertainty.
Sectoral margin divergences and emerging guidance visibility gaps highlight the nuanced risk landscape facing corporate America, where proactive communication and scenario-based planning are increasingly vital. The positive correlation between earnings beats and subsequent guidance upgrades underscores the importance of transparent, forward-looking disclosures in sustaining investor trust and valuation support. Moreover, the manifested capital flows favoring semiconductor innovation and technology infrastructure reflect investor confidence in secular growth drivers that promise to underpin earnings momentum beyond transitory cycles.
Looking ahead, strategic agility anchored in margin durability and selective capital deployment remains imperative. Companies that balance revenue growth with operational efficiency, while navigating geopolitical and macroeconomic headwinds, will likely command superior earnings trajectories and competitive positioning. This evolving paradigm mandates continuous monitoring of market indicators, rigorous scenario analysis, and agile execution to safeguard and augment shareholder value. The insights drawn from Q1 2026 provide a foundational template for corporate and investment decision-making, emphasizing resilience as both a quantitative outcome and a strategic imperative in the dynamic global environment.
References
- What to Expect From These 4 Energy Stocks This Earnings Season?
- A Strong and Steadily Improving Earnings Picture
- SMITHFIELD FOODS INC Q1 2026 Earnings Call Summary
- Genuine Parts Company Q1 2026 Earnings Call Summary
- What’s the earnings outlook for the first quarter of 2026?
- Energy and Other Sectors Drive Earnings Estimates Higher
- Chevron Corporation Q1 2026 Earnings Call Summary
- What Can Investors Expect from Bank Earnings?
- Nike, Oracle, FedEx are part of Zacks Earnings Preview
- Q1 2026 Results Presentation
- estimated - FactSet Earnings Insight
- TECK Q1 2026 News Release
- Forget Geopolitics: Bet on Earnings Growth & Invest in These Sector ETFs
- Q1 2026 Earnings Review: Industry-Wise Financial Highlights and Strategic Developments
- Q1 2026 Earnings Presentation
- Q1 2026 Earnings and Strategic Investments: Comprehensive Insights from Leading Firms and Market Trends
- Q1 2026 Earnings Review: Navigating Growth and Headwinds in Automotive and Technology Sectors
- Airline fuel hedging: who is protected in Iran's fuel crisis
- Technology Sector Earnings & Financial Results | Most Recent Quarter
- 4 Industrial Stocks Set to Outshine Q1 Earnings Estimates
- S&P 500 profits surge over 13% as earnings boom broadens
- Wall Street loses momentum? 🚩 Highlights from the S&P 500 earnings season
- S&P 500 Earnings Season Update: April 24, 2026
- Q1 2026 Earnings Season: Strategic Insights for Leaders - Coleman Management Advisors
- US Q1 earnings: can 13% growth survive geopolitical headwinds?
- Q1 2026 Earnings Preview: Double-Digit Growth and the Visibility Gap | Investing.com
- Earnings Insight
- Q1 Earnings Season to Gain Momentum: What Will it Show?
- S&P 500 Earnings Season Preview: Q1 2026
- S&P 500 Earnings Season Q1 2026: Why This Quarter Could Spark a Rally | TradingMarketSignals
- Samsung, SK hynix Top Global Operating Margins, Outpacing Nvidia
- the impact of shareholders' pre-emption rights on a public ...
- A Practical Guide to Analyze Any Stock (With Examples) - Streamlined Finance Knowledge Base
- The Advertising Agency Profitability Field Guide
- SEP 2021
- Extreme Earnings Forecasts Mask Stock Market Risk - Hussman Funds
- Economic Outlook 2025-27 - ACREDIA
- Rule of 40 - Wikipedia
- SaaS Valuation Multiples: 2015-2024 – Aventis Advisors
- Earnings call: High Liner Foods sees record cash flow despite challenges By Investing.com
- Energy Outlook 2026 Highlights - Energy Outlook 2026 Highlights
- PDF Energy transition investment outlook: 2025 and beyond
- PDF Wakefield Research Whitepaper for Pathward
- PDF What 2025-2026 Tells Us About the Future of Global Energy
- PDF The State of Energy Innovation 2026
- final-discussion-draft-cheap-energy-act-text.pdf
- Short-Term Energy Outlook
- Permitting Reform Needed As Energy, Data Center Demand Surges
- PDF Strengthening resilience in response to the Iran conflict
- Energy Prices, Energy Intensity, and Firm Performance
- PDF Cytonn Q1'2026 Markets Review Executive Summary: Global Markets Review ...
- PDF Viewpoint - mlaem.fs.ml.com
- PDF STANLEY BLACK & DECKER, INC. - d18rn0p25nwr6d.cloudfront.net
- PDF GenTrust 2026 Outlook
- PDF Quarterly Sector and Investment Research Update | Q2 2026 | Fidelity ...
- PDF Eurofins Q3 2025 Results Presentation
- Wall Street loses momentum? 🚩 Highlights from the S&P 500 earnings season
- STX Profit Margin Analysis
- Green Resources PCL Stock Intrinsic Values | - GuruFocus.com
- Essays on the Influence of ESG Scores on Banking ...
- What Are Key Components of Finances in Business?
- Analyzing the impact of corporate social responsibility ...
- Cost Control Beyond Budgeting: Business Management ...
- Predicting changes in profitability with machine learning ...
- Transforming your SaaS business
- Conducting Profitability Analysis: Definition, Types of Profitability Ratios, and Examples - Accounti
- Marketing for Good: How to Authentically Champion Sustainability Efforts
- Sampling Methods - Observational Study of Behavior - OBPA
- Observational Study of Behavior: Sampling Methods
- PDF Designing Practical and Fair Sequential Team Contests
- Learning Value and Style from Soccer Event Stream Data
- An Attributional Theory of Achievement Motivation and ...
- ABC Method
- Golden State Warriors vs. Houston Rockets NBA Cup Matchup Presents Historical Implications
- FAMU football vs Mississippi Valley State: Can the Rattlers avoid a second consecutive upset?
- Analyzing UEFA Euro 2024: Semi-final Matches and Player Performances
- Island Blossom
- PDF Investment Research Update | Q1 2023 | Fidelity Investments
- PDF US Capital Markets Newsletter - 1Q25 - aranca.com
- PDF Quarterly Sector and Investment Research Update | Q1 2026 | Fidelity ...
- FactSet Earnings Insight
- Stocks weaken on dimming hopes for Iran deal, mixed quarterly earnings
- Key charts to help identify current sector trends
- PDF Financial Impact of Supply Chain Disruptions and the Cost-Benefit of ...
- PDF Art of War in Business Applying Sun Tzu: Timeless Strategies for Modern Leadership
- Strategic adaptation: How firms pivot to navigate market shifts and emerging opportunities
- PDF Leading Supply Chains Through Uncertainty: Strategies for Resilient and ...
- Supply Chain Risk Management: A Literature Review, Case ...
- PDF Strategic Human Resource Management: Aligning People and Business Objectives
- Business Impact Analysis for Food Services: Supply Chain Disruptions & Food Safety - Business Impact Analysis Case Study
- 2025 Futures Report | Seizing opportunities in an era of ...
- PDF Corporate Social Responsibility and Organizational Resilience to COVID ...
- Frontiers | Evolution of burnout syndrome in Spanish healthcare professionals during and after the COVID-19 pandemic: psychosocial variables involved
- PDF Abridged version - data.bloomberglp.com
- Monetary Policy after the Great Recession
- PDF S&P 500 Q1 2025 Quarterly Earnings Analysis - consello.com
- Managing our Transition to a Sustainable Future
- Aerospace And Defense Materials Market Size Report, 2030
- Sector Analysis – A Framework for Investors
- EFFECTS OF FLUCTUATING FUEL PRICES ON THE VAR ...
- Fuel Hedging and Risk Management
- PDF Market Outlook October 2024 - saf.rmi.org
- PDF Built for Growth Stanley Black & Decker 2024 Annual Report
- PDF Analyst Day 2025 - s24.q4cdn.com
- Financial Assurance for Decommissioning Costs for Dow ...
- The Food Industry in Brazil and the United States: The ...
- Smithfield Foods Beats Quarterly Estimates On Steady Packaged Meats Demand | ESM Magazine
- 0000050863-15-000015.pdf
- This Stock Goes Up When the Market Goes Down
- Smithfield Foods Reports Record Fiscal 2025 Results
- Markets News, March 24, 2026: U.S. Indexes End Lower After Rallying Monday; Oil Prices Rebound From Sell-Off
- AI-Driven Transformation and Sectoral Dynamics: A Comprehensive Analysis of Q1 2026 Financial Performance and Strategic Outlook
- Q1 2026 Earnings Deep Dive: AI-Driven Tech Supremacy, Pharma Challenges, and Automotive Transformation
- US Semiconductor Market Size, Share & YoY Growth | 2035
- Navigating Growth and Resilience: Q1 2026 Global Earnings Analysis Spotlighting Technology and Financial Services
- Navigating Divergent Corporate Fortunes in Q1 2026: Strategic Resilience Amid Geopolitical and Economic Turbulence
- Q1 2026 Earnings Season Tracker: Complete Preview & Watchlist | Blank Capital Research
- HANMI Semiconductor
- This Stock Is Vital to the Tech Industry and Could Be a Huge Winner This Year
- Q1 2026 Earnings Momentum: Technology and Financial Services Powering Sustained Market Outperformance Amid Sectoral Divergence
- Q1 2026 • Letter to Shareholders
- Teva Delivers Strong Q1 2026 Results Driven by Innovative Portfolio Growth and Disciplined Execution
- Why Plug Power Inc. (PLUG) Is Up +23% in the Last 30 Days
- What’s the earnings outlook for the first quarter of 2026?
- Q1
- PDF Company Announcement No 18/2026 - April 21, 2026 Trading Statement Q1 20
- PDF The TJX Companies, Inc. Fourth Quarter & Full Year Fiscal Year 2026 ...
- Financial Results for the year ended December 31, 2025
- NTAP.OQ - Q3 2026 NetApp Inc Earnings Call
- 【MinebeaMitsumi (6479.T) FY2025 Q3 Earnings Call】Data Center and Automotive Demand Drive Performance; Revenue of ¥453.9 Billion Exceeds Plan; Full-Year Operating Profit Forecast Raised to ¥101 Billion — BigGo Finance
- PDF 1 - 30 - 2026 SoFi Technologi
- Q1 2026 EARNINGS RELEASE CALL
- Earnings Outlook Remains Very Strong: A Closer Look
- US Q1 earnings: can 13% growth survive geopolitical headwinds?
- EARNINGS PER SHARE AS A MEASURE OF FINANCIAL ...
- Strategy Implementation: The 6 Step Process
- PDF The Role of Corporate Governance in Stock Market Valuation
- Strategy Implementation: Key Concepts for Organizational Success
- Your Partners in Change
- A 3 step process to successful strategy implementation | i-nexus
- 2023 notice of annual meeting and proxy statement
- Orkla ASA stock (NO0003733800): Is branded consumer goods resilience the key to steady returns?
- 6 Steps To Successful Strategy Execution & Best Practices
- 5 Strategy Implementation Examples | ClearPoint | ClearPoint Strategy Blog
- Healthcare Sector Earnings & Financial Results | Most Recent Quarter
- Q1 2026 Corporate Earnings: Harnessing AI-Driven Innovation Amid Market Divergence and Strategic Transformation
- What's the Buzz Around Q1 2026 GDP and Why Does it Matter
- Consumer Cyclical Sector Earnings & Financial Results | Most Recent Quarter
- Technology Sector Earnings & Financial Results | Most Recent Quarter
- Macroeconomic and financial impact of conflicts: a study of the ...
- Asset Allocation Insights - March 2026
- Understanding Geopolitical Risk in Investments | MSCI
- Understanding Geopolitical Risk - Moran Wealth Management
- Geopolitical Risk Explained: Why Markets React to Global Events | EBC Financial Group
- PDF "Navigating Global Instability: A Literature Review on Geopolitical ...
- Best Investment Strategies for 2026: Data-Driven Insights and Market Trends
- Central Bank Gold Buying Reaches Historic Highs 2026
- Market Volatility and Short Selling: How Traders Are Profiting Amid Global Uncertainty
- PDF Supply-chain Forecast: Political Trends and Impacts
- Equipment, high-tech manufacturing boost China's industrial profits-Xinhua
- China's industrial profits rise in Q1 as high-tech manufacturing drives growth-Xinhua
- Economic Watch: Equipment, high-tech manufacturing boost China's industrial profits-Xinhua
- UL Solutions Inc. R (72R.DU) Q4 FY2025 earnings call transcript
- Q1 earnings picture mixed as cost pressures persist
- Economy on firm footing at start of '26 - Chinadaily.com.cn
- Big Tech Q1 2026 earnings: Key takeaways on AI spending, cloud growth, and more
- Tech giants report Q1, but do the numbers matter?
- Big Tech AI Capex Hits $650B Amid Q1 2026 Earnings Beats
- Mag 7 Earnings on Deck: AI Monetization and Leadership Transitions Take Center Stage this Week
- Top Growth Stocks to Watch This Week: TSMC, Nvidia and AMD Lead | MEXC News
- US Q1 Earnings 2026 Begin: S&P 500 Profit Growth Seen at 12.5% as Banks, Big Tech Set the Tone
- Lebenthal: NVDA and Micron account for nearly all S&P tech earnings growth
- PDF Q1 2026 8-K - Exhibit 99 - investors.pepsico.com
- PDF World Bank Document
- PDF How Stock Market Reacts to Guidance Revisions and Actual Earnings Surprises
- Investor Update
- Good News: Despite Energy Price Woes, Companies Are Optimistic About Q1 Earnings
- [PDF] FactSet Earnings Insight
- Integer (ITGR) Q1 2026 Earnings Transcript
- SunCoke (SXC) Q1 2026 Earnings Call Transcript
- Ford beats Q1 earnings, raises forecast thanks to $1.3 billion in tariff relief
- PDF Q1 F2026 PR EN - CGI.com
- Q2 FY2026 (July - September 2025) Financial ...
- [PDF] Pfizer Reports Solid Full-Year 2025 Results And Reaffirms 2026 ...
- Petco Reports Fourth Quarter and Full Year 2025 Results
- NAV Financing
- human in the loop• AI and the film value chain
- Corporate governance is essential for preventing white-collar crimes and increasing investor trust | The Corporate Governance Institute
- PDF 2026 MTEF Guidelines Approved (002)
- The role of data in maximising operational efficiency in shipping
- PDF Evolving asset management regulation 2025 report
- Blueprint-for-a-Comprehensive-Oil-and-Gas-Methane- ...
- PDF Consumer Protection in Insurance: a Critical Analysis on Policy Wording & Disclosure
- PDF Corporate Governance in the Digital Economy (A Theoretical Analysis of ...
- Republic of Madagascar
- Stanley Black & Decker, Inc. Q1 2026 Earnings Call Summary
- Equity insights from Q1 company earnings | BlackRock
- PDF Dr. Martens plc Annual Report 2024
- Eastern Bankshares Q1 Earnings Call Highlights
- United Airlines Q1 2026 Earnings Call Summary
- The Goldman Sachs Group, Inc. Q1 2026 Earnings Call Summary
- Can higher oil prices negate damage to Qatari gas plant for Shell?
- Booking Holdings Reports First Quarter 2026 Financial Results
- Q1 2026 S&P 500 Earnings Surge and Market Resilience Amid Geopolitical Turmoil and Technological Transformation
- NOV Q1 2026 presentation reveals earnings miss amid disruptions By Investing.com
- [SLB Q1 2026 Earnings Call] Middle East Conflict Sinks Earnings by $0.20 Per Share; CEO Sees Recovery Driving Multi-Year Investment Surge — BigGo Finance
- Iran War Ripples Hit Hyundai, ServiceNow, Heineken Earnings
- A quarter of two halves
- Halliburton announces first quarter 2026 results
- LVMH Q1 Holds Organic Growth Line Despite Middle East Hit
- Zacks Earnings Trends Highlights: JPMorgan, Citigroup and Wells Fargo
- OIL IN 2026 - Analysts Hike Oil Outlook on Geopolitical Risks, Oversupply Concerns Limit Upside - Energy News, Top Headlines, Commentaries, Features & Events - EnergyNow.com
- Implications of the Iran war for U.S. inflation
- Oil Prices Forecasts: 2026 Oil Price Prediction | Plus500
- Commodity Markets Outlook -- April 2025
- Top 10 2026 Global Economic Transformations and Opportunities Amid Moderating Growth, Persistent Tariff Pressures, and Geopolitical Volatility
- ExxonMobil Price Prediction: How High Will The Oil Stock Go In 2026
- EIA Raises 2026 and 2027 WTI and Brent Crude Price Forecasts | KuCoin
- EIA Raises 2026-2027 WTI and Brent Crude Price Forecasts | Phemex News
- WTI Oil Price Forecast & Predictions for 2026, 2027, 2028–2030, 2040 and Beyond | LiteFinance
- Crude Oil Price Forecast | Strait of Hormuz Closure | Capital.com
- Data Revisions and Bond Return Predictability
- PDF Bank of England Monetary Policy Report - April 2026
- Navigating Q1 2026 Earnings Momentum Amid Sectoral Divergence and Geopolitical Uncertainty: Strategic Insights for Informed Portfolio Allocation
- V. Monetary policy struggles to normalise
- SoundsRide: Affordance-Synchronized Music Mixing for In- ...
- Earnings Surprise Trading: The 3 Patterns That Beat 83%
- Earnings Surprises Explained: A Deep Dive into Their Impact on Stock Prices
- PDF Control and Guidance of A Multi-mode Unmanned Aerial Vehicle for ...
- Earnings call transcript: U.S. Bancorp beats Q3 2024 EPS forecast, stock rises By Investing.com
- Ford Motor Co (F) Q1 2026 Earnings Call Highlights: Strong Revenue and Raised Guidance Amid ...
- Ford Motor Q1 Earnings Call Highlights
- Ford tops Q1 profit forecasts and boosts outlook, but shares fall
- Ford Q1 earnings preview: F-150 production, tariff relief, warranty costs key for investors
- Ford Q1 2026 earnings beat on $1.3B tariff refund
- Ford Motor is set to report earnings after the bell. Here's what Wall Street expects
- Ford beats on Q1 results as tariff repeal boosts profits and guidance; rising commodity costs will weigh on second half
- Wall Street expects solid Q1 results for GM, as Ford and Stellantis try to gain traction
- Ford (F) Stock Down 16% in 2026: Is This the Bottom? - Blockonomi
- Outlook for FY25–26 corporate earnings
- Savita Subramanian Weighs Valuations And Earnings
- HCI Group (HCI) Rises Higher Than Market: Key Facts
- Just 3 stocks are behind 75% of the S&P 500's bullish earnings revisions since the Iran war
- Navigating the Q1 2026 Economic Crossroads: Corporate Earnings Resilience Amid Federal Reserve Policy and Geopolitical Volatility
- PDF From Risk to Opportunity: Bottom-Up Climate Scenario Analysis for ... - GIC
- Navigating Volatility: Q1 2026 Financial Diagnostics and Strategic Outlook for the Refined Oil Industry
- Earnings Momentum Shapes Near-Term Outlook for Leading U.S. Stocks Across Sectors
- PDF Energy Price Shocks, Conflict Inflation, and Income Distribution in a ...
- 3 Reasons to Sell LEU and 1 Stock to Buy Instead
- Profit Margins Strong Among Holdings in These ETFs | ETF Trends
- Stocks Await More Earnings After Strong Start And Better Inflation
- Deep Dive Into Gulfport Energy Stock: Analyst Perspectives (8 Ratings) - Gulfport Energy (NYSE:GPOR) - Benzinga
- Stock Market Today: Stocks Renew Rally Ahead of Mag 7 Earnings
- Q1 2026 Earnings Outlook: Navigating Divergent Sector Growth Amid Geopolitical and Market Sentiment Realignments
- Q1 2026 Financial Sector Performance: Navigating Rebound, Digital Transformation, and Emerging Risks Amid Policy Uncertainty
- PDF Competition, Stability, and Efficiency in the Banking Industry - European Central Bank
- Do firms that state they are financially constrained tend to ...
- RBI Monetary Policy: Decoding India’s Prolonged Rate Hold Strategy – UOB Analysis
- Economic and Revenue Outlook (PDF) | NYS FY 2023 ...
- US Fed Policy Shifts: Impact on KOSPI and Major Korean Stocks - A Data-Driven Analysis
- Federal Reserve Policy Shifts: Navigating Volatility in the KOSPI and Major Corporate Stocks
- The Federal Reserve's Impact on Market Dynamics Amidst Bitcoin Surge and Economic Challenges
- Chevron Corp. (CHV.SG) Q1 FY2026 earnings call transcript
- Chevron (CVX) Q1 2026 Earnings Transcript
- PDF Measuring The Architecture Fit Of System Integration Designs
- How an oil refinery works
- PDF Trends and Effects of Changes in Business Cases for Petroleum Refineries
- Report on the use of LPG as a domestic cooking fuel option ...
- MARKET INQUIRY INTO THE LPG SECTOR FINAL REPORT
- PDF Light Water Reactor Sustainability Program - lwrs.inl.gov
- AI-Driven Predictive Maintenance and Emissions ...
- notice of 2025 annual meeting of stockholders to be ... - Chevron
- Sector Market Perspectives: Q2 2026 | State Street
- PDF S&P 500 Q2 2025 Quarterly Earnings Analysis - consello.com
- ZTE Reports Q1 2026 Revenue of RMB 35B as Computing Mix Climbs to 27%
- FactSet Earnings Insight
- Rethinking Supply Chains in Asia Pacific
- Semiannual Performance Report
- Zacks Industry Outlook Highlights T-Mobile US, United States Cellular Corporation and ATN International | Nasdaq
- Zacks Industry Outlook Highlights Vodafone Group, KT and Ceragon Networks
- PDF Beyond Summaries: Multi-Agent Generation of Investment Reports with Text, Tables, and ...
- Q2 2023 Earnings
- Valuing Firms with Negative Earnings
- VOSTF Summer NM Package
- PDF The Influence of Corporate Earnings Announcements on Stock Market ...
- Earnings Forecast – CXO Advisory
- Equity Research Reports: A Complete Guide for Corporate Professionals
- EBITDA margin by industry - FullRatio
- HOW DO ANALYSTS FORECAST EARNINGS?
- PDF Exploring the Nexus between Debt Financing and Firm Performance: A ...
- Chevron beats profit forecasts as higher prices, Hess assets offset war-related outages
- Chevron Q1 Earnings Beat Estimates, Revenues Increase Y/Y
- Chevron's Quarterly Earnings Preview: What You Need to Know
- Chevron forecasts up to US$2.2 billion rise in upstream earnings from higher first-quarter prices
- Chevron cuts oil output by 6% amid Middle East war — Bloomberg - Business & Economy - TASS
- Allied Gold Reports Record Q4 Production, Advances Growth Strategy and Completes Key Step Toward Transaction with Zijin Gold | Financial Post
- 2022 Annual Report
- PDF Capital Structure: The Choices and the Trade off
- Results for year ended 25 January 2025 – Company Announcement - FT.com
- CHAPTER 8 - NYU Stern
- PDF cfpacket2.ppt - New York University
- PDF Audit Committee Guide - EY
- [PDF] PERFORMING WHILE TRANSFORMING - Bank ABC
- [PDF] Advanced Strategic Management (Strategy, Risk and Improve quality)
- [PDF] Annual report 2025 - AkzoNobel
- [PDF] WOORI BANK
- EcoPro BM Co., Ltd.: Fundamental Analysis and Financial Ratings | A247540 | KR7247540008 | MarketScreener
- LOTTE Corporation: Fundamental Analysis and Financial Ratings | A004990 | KR7004990008 | MarketScreener
- Understanding: The Past Performance Section
- SK hynix Inc.: Fundamental Analysis and Financial Ratings | HY9H | US78392B1070 | MarketScreener
- Microsoft Corporation: Fundamental Analysis and Financial Ratings | MSFT | US5949181045 | MarketScreener
- SK hynix Inc.: Fundamental Analysis and Financial Ratings | A000660 | KR7000660001 | MarketScreener
- Hyundai G.F. Holdings Co., Ltd.: Fundamental Analysis and Financial Ratings | A005440 | KR7005440003 | MarketScreener
- AAOI Profile for Applied Optoelect Stock - Barchart.com
- Ajinomoto Co., Inc.: Fundamental Analysis and Financial Ratings | 2802 | JP3119600009 | MarketScreener
- Hyundai Motor Company: Fundamental Analysis and Financial Ratings | A005385 | KR7005381009 | MarketScreener
- PDF Report to Shareholders for the First Quarter, 2026 - CIBC
- PDF Q1 2026 Announcement - GSK
- Dissecting the Q1 2026 U.S. Earnings Divergence: Structural Drivers and Strategic Insights Across Key Sectors
- March 13, 2026 - 10-K: Annual report [Section 13 and 15(d), not S-K Item 405] | Walmart Inc. (WMT)
- PDF FY2026 First Quarter Financial Results
- Annual Securities Report filed with the Japanese ...
- PDF First Quarter 2026
- [PDF] 2023 Annual Report - Eastern Media International Corporation
- [PDF] Annual Report 2024 - Lundbeck
- 2026 U.S. Business Investment Outlook: Larger than AI
- Power Discrete Semiconductor Market Size, Growth Report, 2034
- Market Forecast Report Semiconductor and FPD ...
- Recent News Release
- Semiconductor Memory Market Size, Share & Forecast Report - 2034
- Optimistic Outlook for AI Sector Stocks
- Semiconductor Market Outlook Optimistic
- Business Results
- Palantir Faces Risk of Stock Price Decline
- Deloitte
- PDF Understanding Weak Capital Investment: The Role of Market Concentration and Intangibles
- Report: America's Highest‑Paid Hotel CEOs in 2025. - CEOWORLD magazine
- Annual Securities Report
- CSA Methodology Handbook 2026 – ATX industry
- PDF Productivity Differences Within the Service Sector: a Statistical Analysis
- PDF How do ex-ante severance pay contracts fit into optimal executive ...
- 8th Pay Commission: Can government salaries finally match private sector perks?
- Eric T. Swanson: Research Paper Abstracts
- Rising unemployment could affect budget, interest rates, pay and more
- UK pay growth slows as inflation pressure weakens
- PDF Up to $4 trillion in revenue may have evaporated in supply chain ... - GEP
- Trump Tariffs : Apple Inc Supply Chain Disruption
- PDF Ijrti - Ijcrt
- Europe Paprika Market Size, Share, Growth & Trends, 2034
- Going global: strategic implications for Chinese brands
- The Macroeconomic Effects of Global Supply Chain Shocks
- Economic Implications of Military Interventions on Trade
- INDIA IN ASIA
- Supply Chain Management: Ensuring Efficiency in ...
- ETF inflows hit record ₹1.8 lakh crore in FY26, driven by surge in gold, silver investments: Report
- Sensex today | Stock Market Highlights: Sensex, Nifty close in red as market breadth turns sharply negative
- ETF Fund Flows as of April 28, 2026
- ETFGI reports Global ETFs Industry Sets Q1 Record as YTD net Inflows Surge 35% Past 2025 High
- Active ETF Q1 Net Inflows up 70% From Prior Record - Markets Media
- PDF S&P 500 Q1 Total Return −4. - myspg.com
- Gold price prediction: Yellow metal to hit $5,000 soon? What experts say
- Global ETF Industry Sets Record - Markets Media
- BlackRock’s Bitcoin ETF Now Rivals Binance, Doubling Coinbase in Daily Volume
- ETF Inflows Hit $462 Billion in Q1 as Investors Ignore Market Drop
- international journal of central banking
- Financial stability analysis using aggregated data
- BANKING SUPERVISION TUNISIA
- PDF Half-yearly Monetary and Financial Stability Report
- PDF GCC banking sector outlook - EY
- FactSet Earnings Insight
- Recapitalised banks poised to drive Nigeria’s $1trn economy ambition – Tribune Online
- PDF The Effect of Regulatory Changes on Banking Performance and Stability
- PDF The Impact of Financial Inclusion on Financial Stability in Asian Countries
- The Impact of Financial Inclusion on Economic Growth, Poverty, Income Inequality, and Financial Stability in Asia -The Journal of Asian Finance, Economics and Business | Korea Science
- Harnessing Earnings Estimate Revisions for Strategic Near-Term U.S. Equity Investing: Empirical Insights and Tactical Applications
- 3 Reasons TDC is Risky and 1 Stock to Buy Instead
- FOR Q1 Deep Dive: Stable Margins and Disciplined Inventory Management Amid Slower Lot Sales
- Solar Panel Business: Overhead Costs & Profit Margins Guide
- Apparel Market Size, Share, Future Trends & Forecast, 2034
- Starlink Business Model: SpaceX Strategy for Global Connectivity - Latterly.org
- 3 Reasons GDDY is Risky and 1 Stock to Buy Instead
- 3 Reasons to Sell EAT and 1 Stock to Buy Instead
- Five9 (FIVN): Buy, Sell, or Hold Post Q4 Earnings?
- 3 Reasons to Avoid GLDD and 1 Stock to Buy Instead
- Strategies for Identifying Undervalued Large-Cap Stocks in Today's Market - Purely Investing
- Beats by Dre Marketing Strategy: Celebrity Endorsements, Athlete Partnerships, and Iconic Red Aesthetic - Latterly.org
- PDF NewsDiffusioninSocialNetworksandStockMarket Reactions
- PDF News Diffusion in Social Networks and Stock Market Reactions National ...
- Will a US Interest Rate Cut Send Crypto Soaring? Expert Analysis Inside! | Cryptodamus
- Political Economy of Foreign Direct Investment
- Geopolitical Risk and Financial Markets: Evidence from the ...
- Risk Management Strategies in Mitigating Investors' ...
- New Evidence on Spillovers Between Crypto Assets and ...
- Do the Most Active Information Providers Sway Investors ...
- 2026 Q1 10Q Earnings Release 8-K
- PDF 2026 Outlook - fa.wellsfargoadvisors.com
- The impact of asset-hedging on insurance companies
- PDF Hedging Strategies in a Volatile Market with Options
- What is Hedging: A Beginner’s Guide to Risk Management
- Oclaro Inc.: Strategic Positioning and Growth Outlook in Next-Generation Optical Networks
- Moderna’s Q1 2026 Financial Surge and Strategic Growth Amid Emerging Tech Investor Movements
- Market and Macro Dynamics in 2026: Fed Policy, Tech and Crypto Trends, and Thematic ETF Risks
- Navigating Earnings Momentum: Strategic Insights from Q1 2026 Corporate Performance and Sectoral Divergence
- Navigating Early 2026 Market Volatility: Strategic Insights on AI Valuation Corrections, Geopolitical Risks, and Sector Resilience
- Best Tech ETFs 2025: AI-Powered Analysis of Top 7 Technology Funds for Investors - Shipra
- Samsung (SSNLF) Reports Record Memory Business Growth Amid AI De
- CrowdStrike (CRWD): AI-Driven Growth Sparks 35% Rally—Balanced Profitability Raises Questions
- Theme-Driven Flow Analysis: Top Buy Signals in HBM, KakaoBank, Batteries, 3D NAND & Voice AI
- SOLiD (KOSDAQ:050890): Earnings Quality & Sector Outlook Amid Market Volatility
- Top 10 insurance trends for 2026
- Industry Trends Archives
- 2026 Global Insurance Outlook
- Navigating Divergent Sectoral Earnings: Strategic Insights from Q1 2026 Corporate Performance
- Are These 3 Insurance Stocks Set to Beat Q1 Earnings Estimates?
- China's insurance sector records steady premium growth in Q1-Xinhua
- Global Insurance Market Report (GIMAR)
- Earnings call: DLG proposes 4p dividend, targets 13% margin by 2026 By Investing.com