Q1 2026 S&P 500 Earnings Review: AI-Powered Tech and Materials Drive Growth Amid Sectoral Divergence and Geopolitical Headwinds
Table of Contents
- Executive Summary
- Introduction
- 1. Q1 2026 Earnings Snapshot: Mixed Performances Across Sectors Highlight Varied Market Outlooks
- 2. Sectoral Earnings Dynamics: Leaders, Moderates, and Aggregates
- 3. Margin Trends and Operational Efficiency: Beyond Top-Line Growth
- 4. Cyclical Versus Defensive Sectors: Shifting Valuation Priorities
- 5. External Influences and Forward Guidance: Risks and Opportunities
- 6. Strategic Portfolio Implications: Weightings and Allocation Choices
- 7. Earnings Quality and Estimate Execution: Signals for Future Performance
- 8. Forward Outlook and Market Confidence: Building Sustainable Momentum
- Conclusion
Executive Summary
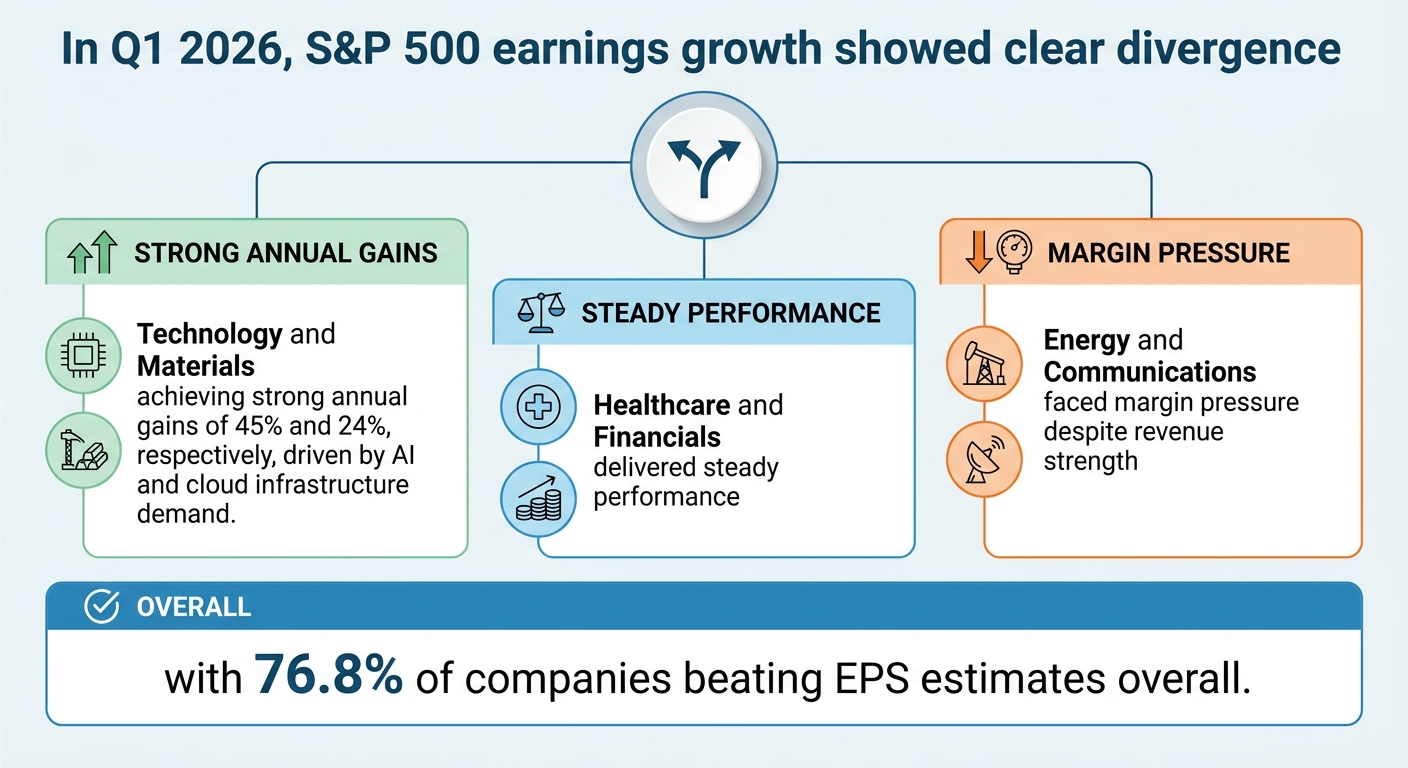
The first quarter of 2026 marked a pivotal earnings season characterized by pronounced divergence among sectors within the S&P 500. Technology and materials sectors led robust growth, registering an approximate 45% and 24% year-over-year earnings increase respectively, predominantly driven by advancing artificial intelligence integration, cloud infrastructure expansion, and elevated commodity prices. Excluding the outsized technology effect, aggregate earnings growth across remaining sectors was a moderate 5–6%. Key technology firms like Micron Technology reported revenue surges exceeding 50%, while materials companies such as Teck Resources doubled adjusted EBITDA, underscoring their critical roles in supporting digital infrastructure and electrification trends.
Conversely, traditional defensive sectors including financials, healthcare, consumer staples, and energy experienced subdued gains amid margin pressures from input inflation, regulatory constraints, and geopolitical tensions. Energy sector margins notably compressed despite Brent crude prices consistently above $100 per barrel, with operating margins declining from 9.6% to 6.6%. Meanwhile, healthcare maintained stable revenue growth near 16% with a high earnings-beat ratio of over 80%. Consensus earnings forecasts firmed to a double-digit growth range of 11–13.9%, reaffirming investor confidence despite ongoing geopolitical uncertainties. Elevated earnings beat rates, averaging 76–84%, reflect strong execution quality, particularly in healthcare and financial sectors, while technology’s mixed surprise profile signals increased risk amid lofty expectations.
Introduction
The earnings landscape in the first quarter of 2026 presents a complex tableau marked by strong innovation-driven growth juxtaposed with sectoral variability and external uncertainties. As markets navigate evolving macroeconomic conditions, technological disruption, and geopolitical volatility, understanding the nuanced performance across industry categories is critical to informed investment decisions and portfolio construction.
This report delivers a comprehensive analysis of Q1 2026 earnings results across the S&P 500, focusing on the pronounced bifurcation between growth-oriented segments, led by technology and materials, and more traditional, defensive sectors facing margin constraints. It explores underlying drivers such as artificial intelligence adoption, cloud infrastructure investments, commodity price dynamics, and the impact of the Middle East conflict on energy earnings.
By synthesizing granular sector data, aggregate earnings trends, margin evolutions, and analyst estimate revisions, the report aims to elucidate the key forces shaping the market’s earnings trajectory. It further examines implications for valuation priorities, investor sentiment, and strategic sector allocation amidst persistent macro and geopolitical headwinds.
Through this lens, stakeholders will gain actionable insights enabling them to balance growth opportunities against risk considerations, thereby optimizing engagement with the current market environment characterized by mixed performances and evolving narratives.
Infographic Image: Infographic
1. Q1 2026 Earnings Snapshot: Mixed Performances Across Sectors Highlight Varied Market Outlooks
Executive Summary: Divergent Sectoral Trajectories Define Q1 2026
This subsection provides a strategic overview of the Q1 2026 earnings landscape, framing the critical contrasts in growth trajectories across sectors. By quantifying tech and materials’ superior performance alongside the more modest gains in traditional industries, it sets the foundation for sector-specific insights that underpin tactical portfolio decisions in subsequent sections.
Quantifying Explosive Growth in Technology and Materials Sectors
The first quarter of 2026 showcased an unmistakable bifurcation within the S&P 500 earnings landscape, with the technology and materials sectors registering exceptional growth that significantly outpaced traditional industries. Information Technology led the charge, delivering an approximate 45% year-over-year earnings increase, predominantly fueled by advancements and investment in artificial intelligence and cloud computing capabilities. Materials followed with a robust 21–24% earnings growth, buoyed by persistent demand for components tied to an expanding datacenter ecosystem and semiconductor supply chains.
This remarkable performance starkly contrasts with the remainder of the index. When excluding the technology sector’s outsized contribution, overall earnings growth for other sectors moderated to roughly 5–6%, underscoring the tech and materials sectors’ pivotal role in driving aggregate growth metrics. The impressive earnings momentum in these areas positioned them as the primary engines for total S&P 500 earnings, warranting concentrated strategic attention from portfolio managers.
Overall, the earnings growth percentages further emphasize this split, with Healthcare, Financials, and Consumer Staples posting more moderate increases of 16%, 12%, and 6% respectively, while Technology and Materials distinctly outperformed at 45% and 24% growth, respectively [Chart: Q1 2026 Year-over-Year Earnings Growth by Sector].
AI and Cloud Infrastructure as Catalysts for Technology Sector Success
Artificial intelligence and cloud computing emerged as dominant forces reshaping earnings dynamics within leading tech firms. The integration of AI-driven solutions into scalable cloud platforms enabled firms to unlock new revenue streams by facilitating enterprise automation, enhanced data analytics, and improved service delivery. Major companies harnessing these technologies—exemplified by leading semiconductor manufacturers and hyperscale cloud providers—witnessed surge effects in both top-line expansion and margin enhancement.
Specifically, AI monetization efforts centered around flagship products such as AI-integrated office suites, generative AI models, and specialized data center hardware have substantiated strong investor confidence through tangible earnings growth. The intensification of cloud infrastructure investments supported sustained demand for raw materials and semiconductors, linking the technology boom to parallel strength in the materials sector. This symbiotic relationship underscores AI's systemic impact across multiple value chains.
Marginal Gains and Stagnation in Traditional Sectors
In contrast to the pronounced advances seen in technology and materials, traditional sectors such as financials, healthcare, consumer staples, and energy exhibited more muted earnings growth. Financial institutions recorded steady increases in earnings, largely driven by sound net interest margin management and cautious capital deployment, but gains remained in the low double-digit range or below. Healthcare maintained consistent revenue growth and an elevated earnings-beat ratio, though overall profit expansion was constrained by slower discretionary spending and sector-specific reimbursement pressures.
Energy and consumer discretionary sectors encountered varied headwinds, including input cost inflation and geopolitical uncertainties that eroded margin prospects despite some top-line resilience. Utilities and communication services faced their own mix of challenges, including regulatory constraints and competitive pressures. Collectively, these sectors contributed incremental but relatively modest improvements to the broader index, reinforcing a market environment characterized by uneven sectoral leadership and heightened emphasis on select growth domains.
Having established the pronounced divergence between dynamic growth in technology and materials and the more subdued performance across traditional sectors, the report now proceeds to dissect sectoral earnings dynamics in greater detail. The following analysis will identify leading performers, moderate contributors, and aggregate trends to inform targeted investment strategies.
2. Sectoral Earnings Dynamics: Leaders, Moderates, and Aggregates
Technology and Materials Lead Q1 2026 Rally on AI-Driven Innovation and Commodity Strength
This subsection dissects the exceptional earnings momentum of the technology and materials sectors during Q1 2026. By quantifying growth metrics, highlighting leading company results, and elucidating the critical drivers behind this surge—namely, AI adoption and semiconductor demand—the analysis anchors the broader narrative on how innovation and strategic resource positioning are reshaping market leadership in this earnings cycle.
Q1 2026 Technology Sector Revenue Surge Fueled by AI and Cloud Demand
The technology sector demonstrated remarkable earnings strength in the first quarter of 2026, underpinned by a 16.7% year-over-year increase in revenues. This growth was notably propelled by broad-based adoption of artificial intelligence (AI) and expanded cloud infrastructure investments, fueling demand for high-performance computing components and software platforms. Key subsectors within technology, including semiconductors and application software, reported robust top-line expansions, indicating sustained operating leverage and effective monetization of AI-driven workloads.
Micron Technology exemplified this technology surge with a fiscal Q1 revenue of $13.64 billion, representing a 57% year-over-year growth. The company’s cloud memory business alone generated $5.28 billion at a 66% gross margin, reflecting strong pricing power amid constrained supply conditions. Furthermore, Micron’s non-GAAP earnings per share of $4.78 significantly outpaced consensus estimates, underpinning confidence in the company’s ability to capitalize on the AI memory shortage and secure long-term contracts with major hyperscalers. This performance not only drives semiconductor sector expansion but also validates AI's integral role in sustaining tech profitability and growth trajectories.
Materials Sector Strength Anchored in Record Copper Sales and Elevated Commodity Prices
The materials sector exhibited significant earnings acceleration in Q1 2026, driven largely by soaring copper prices and record sales volumes. Teck Resources Limited reported adjusted EBITDA of $2.1 billion, more than doubling from the previous year, buoyed by unprecedented copper sales volumes reaching over 70,000 tonnes in the quarter and average copper prices of $5.83 per pound. This spike in commodity prices, combined with operational efficiencies and by-product revenue gains, propelled profit before taxes to $1.3 billion, underscoring the materials sector’s critical role in supporting infrastructure and electrification trends.
Teck’s copper segment alone contributed a gross profit of $1.4 billion, reflecting a substantial margin expansion fueled by both volume growth and premium pricing. The company’s free cash flow generation bolstered its robust liquidity position, consolidating its financial flexibility to invest in upcoming expansions and mergers, notably with Anglo American. These dynamics highlight how strong macroeconomic fundamentals, including infrastructure buildout and green energy initiatives, are directly translating into superior earnings outcomes within the materials domain.
Artificial Intelligence as the Central Catalyst Driving Semiconductor and Materials Demand
Artificial intelligence continues to function as the primary growth engine accelerating semiconductor revenues and pulling downstream demand for materials instrumental in high-tech manufacturing. The surge in AI workloads has caused semiconductor revenue growth to reach unprecedented levels, with memory and logic integrated circuits experiencing year-over-year growth rates exceeding 30%. This demand is amplified by hyperscale cloud providers ramping capital expenditure dedicated to AI infrastructure, which catalyzes investments in memory, storage, and advanced chip architectures.
The technology-driven semiconductor boom exerts upward pressure on materials supply chains, especially for copper and other industrial metals essential to data center buildouts and electrification. This interconnectedness underscores the symbiotic relationship between AI innovation and commodity market strength, positioning technology and materials sectors as complementary beneficiaries of the ongoing digital transformation and infrastructure expansion narratives. The sustained tight supply environment across both chip components and key metals is expected to underpin continued sector outperformance in the near term.
Having established the dominant contribution of technology and materials sectors through AI innovation and commodity strength, the report now transitions to examining the steady performance and underlying drivers within moderate-contribution sectors such as healthcare, industrials, and financials.
Moderate Contributors: Healthcare, Industrials, and Financial Stability Amid Gradual Growth
This subsection situates the steady, moderate sectoral performances within the broader Q1 2026 earnings narrative, providing a detailed account of the healthcare, industrial, and financial sectors’ contributions that contrast with the outsized gains in technology and materials. It emphasizes the consistent revenue momentum, measured recovery, and margin dynamics that define these sectors’ roles in supporting market resilience and informing balanced portfolio decisions.
Healthcare’s Consistent Revenue Growth and Premium Earnings Execution
Healthcare companies demonstrated robust revenue growth of approximately 16% year-over-year in Q1 2026, reflecting sustained demand resilience amid a cautious macroeconomic backdrop. The sector’s earnings quality remains high, with more than 80% of constituent companies meeting or exceeding analyst EPS expectations. This consistent beat rate underscores reliable execution and affirms healthcare as a defensive but stable growth contributor.
Notably, large-cap operators such as HCA Healthcare posted revenue growth aligning closely with estimates, supported by favorable state Medicaid supplemental programs and operational cost efficiencies. Although patient volume softness from seasonal factors and lower respiratory illness prevalence somewhat tempered upside, superior earnings execution safeguarded investor confidence, reinforcing healthcare’s role as a steady sector within an otherwise volatile earnings season.
Industrials’ Measured Recovery Fueled by Capital-Intensive and Defense Growth
The industrials sector realized a measured revenue expansion of roughly 6% year-over-year, with a positive quarter-over-quarter increase near 4%. This growth reflects resilience in capital-intensive sub-sectors, including aerospace, defense, and manufacturing, underpinned by elevated government spending on defense and infrastructure-related investments tied to secular technological advances such as AI data-center expansion.
Earnings quality in industrials is solid, with close to 80% of companies reporting results consonant with or above projections, though margin pressures persisted due to supply chain and cost inflation factors. The sector’s capacity to sustain incremental gains amidst geopolitical headwinds positions it as a moderate yet strategic contributor to broader market earnings momentum.
Financials’ Stable Earnings Growth Supported by Net Interest Margin Improvement
The financial sector recorded a balanced earnings increase in Q1 2026, supported by healthy revenue growth, largely driven by net interest income. Net interest margins saw moderate expansion, with reported figures averaging above 3.6%, representing both quarter-over-quarter and year-over-year improvements primarily due to disciplined deposit pricing strategies and a favorable yield environment on loan portfolios.
Loan growth was steady but selective, focusing on commercial and industrial lending within investment-grade segments, while deposit bases expanded modestly. Expense management and capital returns further underpinned sector fundamentals. These factors collectively contributed to the financial sector’s strong EPS beat rate of nearly 77%, reflecting confidence in earnings quality and operational stability amidst market uncertainty.
The moderate yet dependable growth trajectories and earnings quality observed in healthcare, industrials, and financials complement the broader sectoral landscape by anchoring the market’s foundation. Understanding these dynamics sharpens strategic insights into the balance of growth and stability, setting the stage for subsequent examination of aggregate earnings trends and margin developments.
S&P 500 Earnings Growth Consensus Strengthens Alongside Elevated Beat Rates and Rising Investor Confidence
This subsection integrates aggregate metric analyses to contextualize the S&P 500’s Q1 2026 earnings trajectory within broader market sentiment and execution patterns. It synthesizes consensus earnings growth expectations, the prevalence of earnings beats, and their implications for investor confidence, providing a systemic overview essential for strategic asset allocation under variable economic conditions.
Firming Consensus on Robust Aggregate Earnings Growth in Q1 2026
Consensus forecasts for S&P 500 earnings growth in the first quarter of 2026 have coalesced around a double-digit expansion, generally situated within the range of 11% to 13.9% year-over-year, reflecting a sustained acceleration from prior quarters. This marks the sixth consecutive quarter of double-digit earnings growth, underscoring the resilience of corporate profitability amid ongoing geopolitical complexities and macroeconomic headwinds.
Such growth is substantially driven by pronounced contributions from high-growth sectors, notably technology and energy, which elevate the index-level figures. Excluding the technology sector’s outsized impact reduces projected growth considerably, revealing the critical role of innovation-led segments in current market dynamics. Nevertheless, broad-based sector participation is evident, with up to ten sectors exhibiting positive earnings growth entering Q1 2026, bolstering the consensus outlook.
High Proportions of Companies Surpassing Earnings Estimates Signal Execution Strength
The frequency and magnitude of companies beating consensus EPS estimates in Q1 2026 remain compelling signals of earnings quality and operational discipline. Early reporting data indicate that approximately 76% to 84% of companies exceeded earnings expectations, a figure elevated relative to historical five- and ten-year averages. This favorable beat rate corroborates the underpinnings of the positive growth consensus and reflects robust execution despite cost pressures and supply chain volatility.
Notably, certain sectors such as healthcare and financials demonstrate strong and consistent earnings estimate beats, reflecting high-quality earnings streams. In contrast, the technology sector’s higher growth expectations have led to a more mixed pattern in earnings surprises, increasing narrative risk but also highlighting the sector’s pivotal influence on overall market direction. The magnitude of earnings surprises, often exceeding 7% on average, further emphasizes the consistent outperformance driving investor optimism.
Investor Confidence Reinforces Amid Robust Earnings Beats Despite Geopolitical Concerns
Investor sentiment in early 2026 has notably improved, bolstered by stronger-than-expected earnings results and upward revisions to earnings forecasts, even in the face of persistent geopolitical tensions that could undermine economic confidence. Market participants increasingly favor earnings momentum and execution reliability over headline macro uncertainties, leading to a recalibration of risk premia and portfolio positioning towards growth-oriented sectors.
The data suggests that investors are confident in the sustainability of earnings growth, with volatility primarily responding to short-term geopolitical headlines rather than fundamental weaknesses. This dynamic is evident in the rebound of key market indices and the willingness to maintain or initiate positions in sectors driving earnings expansion. However, the environment remains nuanced, with selective caution advised given potential inflationary and supply-chain risks that could temper future expectations.
Having established the solid aggregate earnings momentum and confirming robust corporate execution through elevated beat rates, the analysis now transitions to examining how these dynamics interplay with margin trends across sectors, a critical factor in assessing the quality and sustainability of the reported top-line growth.
3. Margin Trends and Operational Efficiency: Beyond Top-Line Growth
IT and Financials Dominate Margin Expansion Amid Structural Efficiencies
This subsection examines the operational and financial mechanisms behind the pronounced margin expansions in the information technology and financial sectors during Q1 2026. By dissecting margin drivers, funding models, and efficiency gains, the analysis provides clarity on the sustainability and quality of earnings growth within these pivotal sectors that anchor the broader market advance.
Dissecting IT Margin Drivers Propelling Record Profitability
Information technology companies recorded a margin expansion to 29.1% in Q1 2026, marking a substantial increase from 25.4% a year prior and establishing a new multi-year high. This surge stems primarily from the outsized growth in high-margin segments, notably artificial intelligence and cloud infrastructure services, which boast scalable revenue with relatively stable cost structures. Pricing power has also played a crucial role, as leading firms successfully passed increased costs along to customers amidst robust demand.
Operational efficiencies further bolstered IT profitability. Investments in automation and supply chain optimization yielded productivity gains, offsetting inflationary pressures on input costs. Capital expenditures targeted at expanding data center capacity maintained cost discipline, leveraging economies of scale, and reinforcing gross margin enhancements. Such structural improvements reflect a shift toward platform-based business models, which generate recurring revenues and support sustained margin outperformance.
Financial Sector’s Stable Net Interest Margins and Diversified Income Streams
The financial sector sustained margin improvements against a backdrop of mixed macroeconomic conditions. Net interest margins stabilized near 13.2% at the aggregate sector level, demonstrating resilience despite incremental funding cost increases. This stability derives from strategic shifts in funding mix—particularly the growth of low-cost core deposits—and prudent loan portfolio management that maintained asset yields. Banks increased balance sheet diversification, with capital markets and non-bank subsidiaries contributing a rising share of fee income.
Operational efficiencies have manifested through enhanced risk management, digital transformation, and streamlined credit assessment processes. Such gains reduce non-performing assets and provision costs, underpinning net income growth without necessitating broad margin expansion. The balance struck between interest income and non-interest revenue growth supports a well-rounded earnings profile, facilitating stable returns even as cyclical headwinds modulate credit demand.
Quantifying Efficiency Improvements Driving Sectoral Margin Gains
Key performance indicators signal notable strides in operational efficiency within both IT and financial institutions. In IT, reduced error rates and accelerated decision-making timelines contributed to cost savings and improved customer satisfaction metrics. Financial firms leveraged scorecarding and process automation to integrate strategy with operational delivery, elevating resource allocation effectiveness and reducing operational cycle times.
Data from diverse markets indicate that despite interest rate pressures, effective hedging strategies and market power enabled banks to maintain net interest margins while expanding non-interest income via diversified product offerings. This dual approach to margin management, combined with advances in technology-enabled efficiency, positions the financial sector to sustainably fund growth initiatives and absorb potential future cost pressures.
Having established the distinct mechanisms through which IT and financial sectors have driven margin expansion, the following subsection will contrast these gains with the margin pressures experienced in more challenged sectors such as energy and communication services, elucidating the broad heterogeneity within the market’s operational landscape.
Energy and Communication Services Face Margin Compression Amid Cost and Revenue Pressures
This subsection elucidates the contrasting margin trends observed in the energy and communication services sectors during Q1 2026. By detailing the quantitative impact of input cost inflation and demand-side challenges, it clarifies how revenue growth in these sectors has not translated into proportional profitability. Understanding these sector-specific margin compressions is critical for assessing underlying operational health and identifying targeted risk factors influencing earnings quality.
Quantifying Input-Cost Inflation and its Impact on Energy Sector Margins
In Q1 2026, energy sector margins experienced significant compression driven primarily by elevated input costs amid volatile oil price dynamics. The Consumer Price Index for energy goods and services registered a sharp monthly inflation rate averaging over 3.2% during the quarter, a marked acceleration from the 0.6% rate in Q4 2025, reflecting persistent cost pressures on producers. On an annual basis, energy price inflation stood at approximately 12.5%, a stark contrast to the previous year when prices declined. These inflationary pressures translated into operational cost escalations, particularly in fuel, transportation, and refining inputs, which outpaced the sector's ability to fully pass through expenses to customers due to prevailing geopolitical uncertainties and supply chain constraints.
Despite Brent crude crude oil prices consistently remaining above $100 per barrel for much of Q1, which nominally supported revenue inflows by an estimated $8.6 billion, the net effect on profitability was moderated by rising backward-linked costs. Near-term operational expenses—including energy procurement for upstream drilling, logistics, and maintenance—rose in tandem with oil price volatility, eroding gross and net profit margins. For example, average net profit margins contracted to their lowest observed levels relative to five-year averages, declining from historical norms near 9.6% down to approximately 6.6%. This downward margin adjustment highlights the sensitivity of the energy sector not only to headline price levels but also to input-cost inflation and the timing mismatches in cost recovery through pricing mechanisms.
Consequently, energy firms issued more cautious forward guidance concerning margin prospects, emphasizing continued margin squeezes into mid-2026 unless input cost inflation abates or supply disruptions stabilize. This dynamic underscores the inherent margin volatility in the energy sector, reinforcing the importance of integrating scenario-based risk assessments into portfolio exposure strategies.
Communication Services Confront Revenue Growth but Declining Advertising Margins
The communication services sector demonstrates a notable paradox during Q1 2026: while generating revenue growth of approximately 8.5% year-over-year across most sub-industries, it faces pronounced margin contraction due primarily to declining advertising revenues and intensifying competitive pressures. Four of the five core industries—including interactive media, wireless telecommunication, entertainment, and diversified telecommunication services—recorded robust revenue gains. However, media, the largest advertising-dependent segment, saw a revenue decline of approximately 3%, reflecting broader structural headwinds in traditional advertising monetization models.
Advertising revenues, a critical profit center for broadcast and digital media, suffered significant declines with estimated percentage drops in traditional radio and television channels compounded by softness in legacy digital ad sales. Market analyses indicate nominal radio advertising revenues fell nearly 40% from mid-2000s peak levels when adjusted for inflation, revealing persistent secular headwinds. Despite growth in emerging digital audio platforms and retransmission fees offsetting some losses, the overall advertising revenue base remains under pressure. This translates into shrinking operating margins, as fixed costs and investments in digital transitions limit profitability gains.
Moreover, heightened competition from global digital platforms and shifting consumer attention toward non-traditional media exacerbates the margin squeeze. Compounded by ongoing client budget reductions in sectors such as telecom, media, and entertainment—where like-for-like revenues declined between 6% and 13%—communication services firms face constrained pricing power. As a result, Q1 margins declined considerably, with sector-wide net profit margins contracting from roughly 16.0% to 14.1% compared to prior-year levels, signaling structural challenges in margin retention despite top-line expansion.
This immediate margin pressure suggests the communication services sector will require continued operational realignment and innovation to stabilize profitability. Investors should remain vigilant to evolving revenue mix shifts and margin recovery timelines when evaluating sector exposure.
Together, these distinct margin trajectories in energy and communication services reflect the asymmetric impact of input cost inflation and demand-side disruptions within sectors experiencing revenue growth. This divergence underscores the criticality of nuanced margin analysis beyond headline earnings, guiding strategic asset allocation decisions amid uneven operational challenges.
4. Cyclical Versus Defensive Sectors: Shifting Valuation Priorities
Cyclical Outperformance Amid Macroeconomic Caution: AI and Infrastructure Drive Earnings Share
This subsection examines the notable earnings dominance of cyclical sectors in Q1 2026, exploring the quantitative influence of artificial intelligence and infrastructure spending on their outsized contributions. It situates these trends within the prevailing macroeconomic uncertainties and investor appetite for growth assets, providing essential insight into sector rotation dynamics and strategic allocation opportunities.
Quantifying AI’s Contribution to Cyclical Earnings Share
Cyclical sectors accounted for approximately 43.2% of total S&P 500 earnings in Q1 2026, a remarkable figure underscoring their continued market leadership amid economic ambiguity. A significant portion of this cyclical earnings uplift is traceable to the integration of artificial intelligence (AI) across a broad swath of industries, particularly technology and related sectors such as information technology hardware, financials, and industrials. AI’s infusion into business operations has accelerated revenue generation and margin expansion by enhancing operational efficiency, optimizing supply chains, and driving innovative product offerings.
Specific AI-driven earnings growth is evident in quarterly results revealing 15-25% annualized EPS growth potential across segments tied to AI hardware and infrastructure, with technology firms adopting AI enjoying disproportionately higher earnings expansion than non-AI peers. This AI impact is not isolated to a handful of mega-cap tech companies but increasingly permeates financial institutions and industrial firms as they leverage AI for automation, risk management, and customer engagement enhancements.
Infrastructure Spending’s Role in Sustaining Cyclical Sector Strength
Infrastructure investment remains a critical support pillar for cyclical earnings, evidenced by substantial capital expenditures in energy, materials, and industrial sectors. Despite some regional variability, including near-term softness in certain emerging markets, global infrastructure outlays are robust, fueled by multi-year government programs targeting transportation, energy grid modernization, and manufacturing upgrades. For instance, national infrastructure pipelines encompass over $500 billion in committed investment over the next decade, with a pronounced focus on electrification and clean energy initiatives that benefit cyclicals like materials producers and industrial machinery manufacturers.
Such capital expenditures underpin demand for metals, equipment, and construction services, translating into sustained revenue growth for related cyclical companies. Furthermore, infrastructure projects serve as a hedge against slower consumer spending growth, enabling cyclical sectors to maintain momentum through government and private sector activity even when headline economic signals appear cautious.
Investor Sentiment and Preference for Growth Amid Geopolitical Risks
Investor behavior in Q1 2026 reveals a pronounced tilt toward growth-oriented cyclical sectors, despite ongoing geopolitical uncertainties such as Middle East tensions, which have heightened volatility and raised caution regarding broad economic prospects. Market participants have favored sectors exposed to secular growth trends—particularly AI adoption and infrastructure modernization—viewing these as resilient drivers of earnings and shareholder returns amid rising risk premiums in fixed income markets.
This preference diverges from historical norms where defensive sectors typically outperform during geopolitical or macroeconomic stress. The current environment reflects a nuanced landscape where equity investors prioritize long-term secular growth over short-term risk aversion, underscoring a rebalancing dynamic with cyclical equities commanding premiums well in excess of what bond yields and traditional fundamentals might suggest. Confidence in cyclical sectors is further supported by robust earnings beats and upward revisions, reinforcing their appeal as tactical overweight options within diversified portfolios.
Building on the demonstrated cyclical sector strength driven by AI and infrastructure momentum, subsequent analysis will assess defensive sectors’ performance and the inherent trade-offs investors face when balancing growth exposure with stability amid an uncertain macroeconomic backdrop.
Defensive Resilience Under Scrutiny: Healthcare Stability, Utilities’ Revenue Surge, and Profitability Trade-Offs Versus Cyclicals
This subsection critically examines the defensive sectors' performance in Q1 2026 by quantifying healthcare’s earnings growth rates, evaluating utilities’ revenue expansion against limited margin improvement, and contrasting overall profitability metrics with cyclical sectors. Understanding the balance between defensive stability and cyclical vigor provides strategic clarity for portfolio risk calibration and sector allocation amid current market dynamics.
Quantifying Healthcare’s Earnings Stability as a Defensive Anchor
Healthcare demonstrated moderate yet resilient earnings growth during Q1 2026, with aggregate sector revenue increasing approximately 16% year-over-year, underpinned by a solid beat rate exceeding 80%. This performance reflects strong earnings quality, especially considering challenging dynamics within prominent sub-industries marked by uneven results, such as managed care and biotech segments. For instance, major healthcare providers reported revenue increases near 4%, supported by favorable payer mix adjustments and cost management, although offset partially by seasonal headwinds in patient volumes.
Despite some sector headwinds, the overall healthcare earnings trajectory signifies a dependable defensive characteristic, as discretionary spending patterns remain muted but healthcare demand exhibits inelasticity. The sector’s capacity to sustain positive top-line and earnings momentum, albeit at a measured pace, reinforces its role as a stabilizing force in environments of economic uncertainty. This is further evidenced by a consistent high percentage of companies meeting or beating consensus estimates, signaling reliable earnings execution distinct from more volatile cyclical segments.
Utilities’ Robust Revenue Growth Versus Stagnant Margin Expansion: Operational Constraints and Regulatory Influence
In Q1 2026, utilities reported a pronounced revenue increase of nearly 29% year-over-year, one of the highest among defensive sectors. This surge largely derives from rising energy consumption and successive rate adjustments, reflecting heightened demand resilience and regulatory-approved price hikes. Quarter-over-quarter data further indicate an 8.2% revenue uptick, revealing ongoing operational leverage potential within this cohort.
However, the notable revenue escalation contrasts sharply with flat net profit margins, which held steady at approximately 14.6%, showing no material improvement compared to prior periods or five-year historical averages. This margin stability, rather than expansion, is attributable to regulatory frameworks limiting profit maximization, as utilities operate within tightly controlled rate environments that cap pricing power. Additionally, escalating input costs, such as infrastructure maintenance, environmental compliance, and vegetation management, exert upward pressure on expenses, constraining margin growth despite revenue gains.
This dichotomy underscores the sector’s structural challenges in converting robust top-line dynamics into enhanced profitability, reflecting the trade-off defensive sectors face between steady earnings and constrained operating leverage.
Comparing Defensive Stability to Cyclical Profitability: Earnings and Margin Trade-offs in Q1 2026
When juxtaposed with cyclical sectors, defensive sectors exhibit substantially different earnings and profitability profiles in Q1 2026. Cyclicals, driven by technology and materials dominance, posted both higher revenue growth and more pronounced margin expansion, contributing disproportionately to overall index earnings. In contrast, defensive sectors such as healthcare and utilities delivered more modest earnings growth accompanied by largely stable or contracting margins.
Profitability metrics in defensive sectors reflect their inherent stability but limited upside potential. For example, healthcare’s operating margins hover in the mid-single-digit to low double-digit range, constrained by regulatory and reimbursement environments. Utilities’ net profit margins around 14.6% are comparably less volatile but exhibit a plateauing effect due to regulated returns. Conversely, cyclical sectors demonstrated margin expansions well above the historical averages, capitalizing on pricing power and operational efficiencies amid favorable secular trends.
This contrast delineates a clear trade-off: defensive sectors offer earnings resilience and lower volatility but sacrifice the higher profit growth and margin leverage observable in cyclical sectors. From a portfolio construction perspective, this emphasizes the importance of balancing defensive cushions against cyclical growth drivers to optimize risk-return profiles under prevailing market conditions.
Having established the nuanced performance contours and inherent limitations within defensive sectors, the analysis naturally progresses toward evaluating the cyclical sectors’ earnings dominance and strategic implications, further dissecting the shifting valuation priorities shaping the 2026 market landscape.
5. External Influences and Forward Guidance: Risks and Opportunities
Oil Price Surges and Middle East Tensions Shape Energy Sector Earnings in Q1 2026
This subsection critically examines the quantifiable influence of Brent crude price movements and geopolitical volatility stemming from the Middle East conflict on the energy sector's Q1 2026 earnings. It contextualizes how these external shocks have not only driven earnings uplift but also prompted analyst revisions, providing a nuanced understanding of risk and opportunity embedded within energy sector performance during this period.
Quantifying Brent Crude Price Impact on Q1 2026 Energy Earnings
The energy sector's earnings performance in Q1 2026 was strongly influenced by Brent crude prices sustaining levels near $100 per barrel, with episodic spikes above $117 during the quarter. These elevated prices translated into a substantial earnings uplift, estimated at approximately $8.6 billion for the sector. The price surge reflected the embedding of heightened geopolitical risk premiums and tightening supply constraints linked to the Middle East conflict, markedly enhancing upstream producer profitability.
Importantly, the relationship between every incremental $1 increase in Brent crude price and after-tax energy sector earnings has been calibrated at roughly $650 million, underscoring the sensitivity of large integrated producers to market fluctuations. However, realized earnings benefits were nuanced by factors such as variable production volumes, tax adjustments, and hedging activities, which moderated but did not offset the aggregate positive impact on sector profits.
Middle East Conflict Timeline and Its Alignment with Analyst Estimate Revisions
The escalation of conflict in the Middle East from late February through April 2026 catalyzed significant disruptions, with key milestones including joint US-Israeli strikes on Iranian leadership targets at the end of February, progressing to the closure of the Strait of Hormuz in early March. This critical choke point remained largely closed until early April, severely constraining global oil transit and amplifying market uncertainty. Peak disruptions in mid-March pushed Brent prices close to $120 per barrel before partial stabilizations followed a ceasefire announcement in early April.
These event-driven dynamics tightly aligned with upward revisions in energy sector earnings estimates beginning in early March. Analysts incorporated the realized and anticipated effects of supply bottlenecks, price volatility, and heightened risk premiums into their models, leading to notable upgrades in sector growth expectations despite ongoing geopolitical uncertainty.
Sectoral Analyst Revisions Correlated with Geopolitical Developments and Market Sentiment
Analyst revisions across the energy sector distinctly trended upward during the Q1 2026 period, driven by elevated commodity pricing and the disruptive effects of the Middle East conflict. Notably, major integrated energy companies such as Shell and BP reported substantial earnings growth, with Shell’s Q1 forecasts improving by nearly 50% post-conflict onset, attributed to exceptional oil trading gains and higher midstream margins in a volatile price environment.
Conversely, some subsectors experienced offsetting pressures. Downstream refiners faced margin compression caused by timing mismatches in hedging strategies and operational disruptions, tempering the aggregate uplift. Nonetheless, the net revision trajectory remained positive, reinforcing energy’s pivotal role in S&P 500 earnings growth revisions. This duality underscores the nuanced impact of geopolitical events—providing significant upside through commodity pricing while exposing operational vulnerabilities in processing and logistics.
Having delineated how Brent crude price elevations and geopolitical tensions concretely influenced energy sector earnings and analyst outlooks, the analysis next addresses broader sector-specific cost pressures and margin constraints that modulate profitability under these challenging conditions.
Sector-Specific Cost Pressures and Margin Constraints: Navigating Inflation and Operational Challenges in Q1 2026
This subsection examines the persistent and varied cost pressures impacting margins across key sectors such as consumer discretionary, staples, and energy during Q1 2026. By quantifying operational expense increases and unpacking underlying drivers like packaging, freight, labor, and energy cost inflation, it highlights how these factors constrain profitability despite revenue gains. This analysis informs forward guidance assessments and sectoral risk evaluations, crucial for strategic portfolio positioning amid ongoing inflationary challenges.
Rising Packaging, Freight, and Labor Costs Undermine Consumer Sector Margins
Consumer discretionary and staples sectors faced sustained margin pressures in Q1 2026 driven by elevated input costs. Packaging materials, which comprise approximately 20% of total costs in these industries, experienced inflation due to higher crude derivatives pricing and supply chain disruptions, compressing operating margins despite steady revenue trajectories. Additionally, freight expenses remained elevated from ongoing shipping route disruptions and fuel cost hikes, intensifying the cost burden on distribution networks.
Labor cost escalation further compounded these pressures, with wage growth and staffing shortages pushing operational expenses higher across manufacturing and retail segments. These cumulative cost increases outpaced the ability of many firms to pass through prices fully, thereby intensifying margin compression. Companies signaled cautious optimism around price hikes planned for subsequent quarters but noted the risk of demand sensitivity curtailing rapid margin recovery.
Recent sector commentary corroborates these challenges, highlighting that cost inflation is especially impactful in categories with thin baseline margins and high competitive intensity. The interplay of packaging, freight, and labor costs requires firms to intensify operational discipline and cost management to safeguard profitability in the near term.
Energy Sector Grapples with Cost Inflation Despite Revenue Tailwinds
The energy sector, while benefiting from elevated oil prices that bolstered top-line results, faced significant operational cost pressures that constrained margin expansion in Q1 2026. Input cost inflation arose primarily from increased prices of natural gas and electricity, particularly impacting upstream and power generation segments reliant on fossil fuel inputs.
Quantitative estimates indicate that LNG-related utility costs surged by up to 25% in fab operations and energy-intensive facilities during this period, reflecting a direct transmission of crude oil price surges above $100 per barrel into labor and energy expenses. This dynamic compressed gross margins on several key products and service lines, requiring careful forward guidance to balance revenue gains against rising expenditures.
Sector analyses also emphasize geopolitical tensions as a source of ongoing supply chain risk, creating volatility in procurement costs and complicating operational planning. Despite higher revenues, net profitability faced headwinds from these cost dynamics, underscoring the importance of adaptive cost controls and strategic capital deployment to mitigate margin erosion.
Empirical Insights from Recent Sector Reports Corroborate Margin Headwinds
Recent reports underscore the widespread nature of margin pressures across consumer goods and energy sectors, with elevated packaging, freight, and labor costs consistently cited as primary drivers. Analyses reveal that despite attempts to leverage pricing power, competitive dynamics and consumer sensitivity limit the scope for immediate cost pass-through, necessitating alternative margin survival strategies.
In the energy sector, studies highlight that operational cost increases stemming from natural gas and electricity price surges are partially offset by efficiency gains and technology adoption, but remain a material drag. Regulatory changes and shifting energy mix considerations add complexity to cost structures, requiring ongoing refinement of guidance and investment decisions.
Collectively, these sources provide a comprehensive picture of nuanced margin compression patterns in Q1 2026, reinforcing that observed profitability constraints arise from multifaceted, sector-specific cost inflation sources rather than transient or singular shocks.
Having delineated the cost-associated margin constraints faced by pivotal sectors, the report proceeds to assess the strategic implications of these pressures for portfolio allocation and risk management. Understanding the interplay between inflationary challenges and revenue drivers facilitates informed decisions on sector exposures and tactical positioning.
6. Strategic Portfolio Implications: Weightings and Allocation Choices
Cyclical Dominance Reinforces Growth-Oriented Tilts Amid Valuation Constraints
This subsection provides a focused analysis of the pronounced earnings contribution from cyclical sectors in Q1 2026 and evaluates the current valuation and positioning dynamics limiting defensive sector weightings. It integrates quantitative earnings share data and market perspectives to substantiate the rationale for growth-oriented portfolio tilts toward cyclical assets, framing these insights within broader macroeconomic and market valuation contexts.
Quantifying Cyclical Sectors’ Dominance in Q1 2026 Earnings Contributions
Cyclical sectors accounted for a substantial 43.2% of total S&P 500 earnings in the first quarter of 2026, underscoring their pivotal role in driving near-term market momentum. This grouping encompasses eleven broad industry categories, including Consumer Discretionary, Industrials, Basic Materials, Energy, Finance, and Construction, all of which benefited from secular tailwinds such as AI-driven technology deployment and accelerated infrastructure spending. Despite ongoing geopolitical uncertainties, cyclical subsectors exhibited resilience, underpinned by elevated demand in related capital expenditures and business services.
Notably, Financials and Materials sectors demonstrated strong double-digit earnings growth rates, supporting this cyclical outperformance. The Energy sector’s contribution, amplified by elevated oil prices and geopolitical tensions, further bolstered the aggregate cyclical share. While some individual cyclical subsectors faced margin pressures from input cost inflation, the overall earnings growth profile validated the strategic emphasis on these areas within index compositions during this period.
Valuation Constraints and Saturated Positioning Limit Defensive Sector Upside
In contrast, defensive sectors such as Healthcare and Consumer Staples displayed valuation saturation and constrained upside potential in Q1 2026. Defensive equities have historically been favored for their earnings stability and lower beta characteristics amid macroeconomic uncertainty; however, current market dynamics show stretched positioning levels and relatively elevated price-to-earnings multiples that dampen incremental gains. This valuation plateau limits the scope for further multiple expansion despite supportive fundamentals intrinsic to regulated and essential service sectors.
Additionally, idiosyncratic earnings challenges within certain defensive subsectors contributed to muted performance. While healthcare continued to showcase high-quality earnings beats, incremental growth remained slower, bounded by cautious consumer spending and regulatory considerations. Utilities and staples posted modest revenue increases accompanied by margin stagnation, further signaling limited margin for valuation re-pricing absent shifts in macroeconomic variables such as interest rates. This environment necessitates a more tactical approach toward defensives, balancing stability against their current market-floor valuations.
This defensive sector resilience is further highlighted by the Q1 2026 earnings beat rates, where Healthcare emerged as the standout with an 81% beat rate, followed by Financials at 77%, and Technology close behind at 76%. In contrast, Consumer Staples and Communication Services lagged with 70% and 60% beat rates respectively, underscoring the variable earnings surprise landscape within defensives and cyclicals alike [Chart: Q1 2026 Earnings Beat Rates by Sector].
Deutsche Bank’s Tactical Recommendation: Emphasizing Cyclicals Amid Defensive Saturation
Deutsche Bank’s market analysis aligns with these earnings and valuation trends, advocating for a strategic overweight in cyclical sectors given their dominant earnings contributions and growth trajectories. Their assessment underscores that while defensive sectors continue to provide essential portfolio ballast amid volatility, they face headwinds stemming from elevated valuations and constrained earnings growth opportunities in the near term.
The bank highlights that cyclical subsectors, though more sensitive to macroeconomic shifts and input cost inflation, remain better positioned to capture value creation from ongoing secular themes such as artificial intelligence integration and infrastructure investments. Consequently, they recommend selective tactical entry into cyclical equities aligned with these secular trends, emphasizing the potential for further earnings upside as energy prices stabilize and geopolitical risks evolve. This approach balances the need for exposure to growth drivers while maintaining risk awareness amid prevailing external uncertainties.
Having established the rationale for cyclical overweight positioning driven by superior earnings contributions and valuation considerations, the subsequent subsection will explore tactical instruments such as sector-specific ETFs that facilitate granular exposure to these high-conviction sectors while managing risk and liquidity constraints.
Sector ETFs Offer Tactical Entry Points Amid Diverse Momentum and Geopolitical Nuances
This subsection examines exchange-traded funds (ETFs) as tactical vehicles to capture sector-specific momentum identified in Q1 2026 earnings trends. By integrating quantitative performance data, geopolitical considerations, and valuation assessments, it guides strategic allocation decisions in volatile markets, complementing broader portfolio weightings and risk management frameworks discussed earlier.
Leveraging Technology and Materials ETFs to Harness AI and Infrastructure-Driven Growth
Technology and materials ETFs remain at the forefront for investors seeking to capitalize on the robust secular tailwinds powered by artificial intelligence advancements and significant infrastructure investments. Leading technology sector ETFs have demonstrated consistent double-digit earnings growth, supported by surging demand for semiconductor manufacturing and cloud infrastructure solutions. Key funds like the Invesco QQQ Trust and VanEck Semiconductor ETF offer concentrated exposure to dominant AI enablers, while thematic ETFs focusing on cloud computing and internet economies provide diversified access to the broader technology ecosystem.
Quantitative momentum indicators underscore strong relative performance in these ETFs, with year-over-year earnings surging by over 25% in the technology segment. These momentum factors reflect durable revenue growth and operational leverage amid elevated capital spending across data centers and next-generation hardware. Moreover, earnings revisions remain positive, signaling analyst confidence in sustainability. Tactical entry into technology and materials ETFs can therefore provide an efficient means to gain exposure to innovation-driven growth, particularly as fundamentals outweigh prevailing geopolitical uncertainties.
Energy ETFs: Navigating Geopolitical Tailwinds and Duration-Sensitive Risks
Energy sector ETFs have transitioned from cyclical trades to strategic holdings amid persistent geopolitical tensions, such as disruptions tied to the Strait of Hormuz and broader Middle East instability. Elevated oil prices above $100 per barrel have materially increased energy sector earnings, creating compelling upward momentum for ETFs focused on crude producers and integrated energy companies. Funds like the Energy Select Sector SPDR ETF (XLE) and Vanguard Energy ETF (VDE) have benefited from increased free cash flows and disciplined capital allocation in a tightening supply environment.
However, investors must weigh these gains against distinct duration risks given the uncertain timeline of geopolitical developments. Leveraged energy ETFs offer amplified exposure but carry heightened volatility and potential for sharp reversals, making them better suited for short-term tactical plays rather than long-term holds. Furthermore, rising input costs and sector-specific operational challenges necessitate vigilant monitoring of forward guidance. The energy ETF outlook thus hinges critically on evolving geopolitical dynamics, supply restoration timelines, and regulatory shifts affecting both traditional hydrocarbons and the clean-energy transition.
Defensive Sector ETFs in a Volatility-Easing Environment: Assessing Healthcare and Staples
In a market environment characterized by volatility moderation and selective risk-on sentiment, defensive-oriented ETFs—particularly within healthcare and consumer staples—may present undervalued opportunities. The Vanguard Health Care ETF (VHT) continues to exhibit resilience, supported by steady earnings beats and growth in non-discretionary medical services, pharmaceuticals, and health technology subsegments. Its low expense ratio and diversification across sector sub-industries underpin its appeal as a safe haven during episodic market stress.
Consumer Staples ETFs, exemplified by the Consumer Staples Select Sector SPDR Fund (XLP), benefit from predictable revenue streams and dividend stability, although margin pressures from elevated packaging and labor costs persist. These cost headwinds have tempered earnings surprises but have not materially disrupted free cash flow profiles. As volatility eases and the macroeconomic outlook stabilizes, defensive ETFs positioned in these sectors could serve to balance growth-oriented tactical allocations, offering downside protection while preserving income generation.
Building on the evaluation of sector ETF opportunities, the following discussion will integrate these tactical insights into broader allocation strategies, emphasizing cyclical growth tilts and the evolving risk-reward calculus in Q1 2026’s mixed earnings landscape.
7. Earnings Quality and Estimate Execution: Signals for Future Performance
High Beat Rates Signal Reliability in Certain Sectors Amid Mixed Market Execution
This subsection evaluates the consistency and reliability of earnings performance in key sectors during Q1 2026, focusing on beat rates as critical indicators of earnings quality and estimate execution. By dissecting healthcare, financials, and technology sectors’ surprise metrics and analyzing market capitalization influences on earnings surprises, we establish a nuanced view of sectors with dependable earnings delivery versus those exhibiting elevated risk. This assessment informs confidence levels around forecast accuracy and identifies sectors where beat rates bolster strategic allocation decisions.
Healthcare Sector’s Robust Earnings Beat Rates Confirm Earnings Quality
The healthcare sector demonstrated notably strong earnings quality in Q1 2026, with approximately 81% of reporting companies surpassing earnings per share estimates. This beat rate reflects a consistently high level of estimate precision and resilience despite broader macroeconomic headwinds, supported by both established providers and diversified care delivery firms. Exemplars such as CVS Health and UnitedHealth delivered robust top-line growth and significant upside to consensus forecasts, with CVS notably exceeding EPS estimates by 16.5% and UnitedHealth by 9.4%, underscoring the sector's dependable earnings execution.
Steady revenue growth, combined with operational efficiencies and managed cost structures, underpins healthcare’s high beat frequency. Leading companies within the sector reported year-over-year revenue increases ranging from mid-single to low-double digits and maintained or expanded operating margins, reinforcing confidence in forecast accuracy. The healthcare beat rate’s strength signals not only fundamental sector resilience but also validates its defensive role in portfolio construction during periods of earnings uncertainty.
Financial Sector Beat Rates Align with Historical Performance, Reflecting Effective Estimate Management
The financial sector sustained a solid earnings beat rate of approximately 76.7% in Q1 2026, reaffirming its historical tendency toward reliable estimate execution. Earnings growth in the sector was supported by favorable net interest margins amid a high-rate environment, alongside prudent capital and risk management strategies that have enhanced predictability. Institutions such as major banks and insurance companies effectively leveraged higher interest income while containing credit risks, contributing to earnings outcomes that steadily outperformed analyst expectations.
Comparatively, this beat rate aligns with recent quarterly averages, suggesting continuity in the sector's ability to manage earnings guidance rigorously and meet market forecasts. The steadiness of financial sector beats enhances its attractiveness within balanced portfolios, particularly given its significant contribution to overall index earnings growth. However, investors should remain cognizant of potential cyclical risks linked to loan demand fluctuations and regulatory shifts that could introduce volatility beyond near-term forecasts.
Technology Sector Exhibits Mixed Beat/Miss Patterns Amid Elevated Expectations and High Growth
While technology remains the foremost growth engine, its Q1 2026 earnings beat rate of roughly 76% reveals a more nuanced narrative characterized by elevated consensus expectations and market sensitivity to execution risk. The sector's outsized earnings growth — driven by artificial intelligence adoption, cloud infrastructure expansion, and semiconductor demand — has propelled significant upside but also intensified dispersion in actual versus forecast results across constituents.
Notably, megacap technology firms exhibited substantial upward revisions but experienced some variability in surpassing targets, increasing narrative risk especially for high-profile companies with aggressive growth assumptions. This mixed execution contrasts with the more stable beat profiles in healthcare and finance and signals that while technology generates rapid earnings acceleration, it also carries amplified estimate risk. Such dynamics require careful scrutiny of company-specific fundamentals and a calibrated risk appetite among investors focusing on innovation-led growth.
Market capitalization further influences surprise distributions within technology; larger-cap firms tend to sustain higher positive surprise expectations compared to smaller peers that show elevated probabilities of downside surprises. This segmentation reflects differing analyst coverage intensities and operational visibility, underscoring the importance of market cap considerations in evaluating sector-wide earnings quality.
Market Capitalization Effects on Earnings Surprise Distribution Underpin Sectoral Differentiation
Analysis based on Citi’s earnings surprise model underscores the relevance of market capitalization in shaping the probability and magnitude of earnings surprises across sectors. The largest quintile of firms by market capitalization exhibited a positive surprise expectation near 76%, suggesting greater stability and forecast accuracy among larger, more established companies.
Conversely, smaller-cap firms displayed materially lower positive surprise probabilities, around 46.5%, highlighting increased earnings volatility and greater risk of disappointing outcomes. This market cap-related segmentation is particularly pronounced in sectors such as information technology, where high growth is weighted toward prominent large-cap players who tend to execute more consistently relative to smaller, often more volatile, constituents.
Recognizing these distributional patterns assists in portfolio construction by informing risk management strategies that differentiate exposures not only by sector but also by firm size within sectors, thereby optimizing balance between growth potential and earnings predictability.
Understanding these sector-specific earnings execution patterns, including the interplay of beat rates and market capitalization effects, equips investors with a granular view of quality and risk. This sets the stage for evaluating the sectors vulnerable to negative surprises, elaborated in the subsequent subsection, which highlights areas warranting caution and strategic hedging.
Negative Surprises Highlight Vulnerabilities in Consumer Discretionary, Staples, and Communication Services
This subsection focuses on identifying and quantifying the key sectors exhibiting downward earnings revisions and margin pressures in Q1 2026. By dissecting the consumer discretionary, consumer staples, and communication services sectors, it elucidates the structural challenges and demand-side shifts underpinning these negative surprises. This analysis is critical for understanding sector-specific risks and informs risk management and tactical portfolio adjustments amidst broadly mixed market signals.
Quantifying Q1 2026 Negative Revisions in Consumer Discretionary
The consumer discretionary sector faced significant downward revisions during the first quarter of 2026, driven primarily by muted discretionary spending amid persistent inflationary pressures on households. Warnings from major retail and automotive segments highlighted cautious consumer behavior, curbing growth expectations. Earnings estimates for this sector were cut notably, reflecting both top-line softness and margin compression as elevated living costs constricted purchasing power. This translated into a below-average earnings surprise frequency compared to broader market norms, signaling material challenges in the sector's ability to deliver versus analyst forecasts.
Factors contributing to this negative revision wave include the sustained impact of higher interest rates dampening consumer financing and a shifting consumer preference towards value-oriented purchases and essentials. The sector’s concentration in discretionary categories makes it especially sensitive to these trends, which eroded confidence in short-term earnings sustainability. Given the sector's substantial weight in market indices, these revisions imposed a consequential drag on overall market sentiment and underscore the need for close sector-specific surveillance.
Margin Compression and Cost Drivers in Consumer Staples
Consumer staples, while traditionally more defensive, encountered persistent margin pressures in Q1 2026, primarily due to elevated input costs such as packaging materials, freight charges, and labor expenses. Despite relatively stable demand for essential goods, companies within this sector struggled to fully pass on cost increases to consumers amid heightened price sensitivity and competition from private-label brands.
The resulting margin compression averaged close to a 1% decline across leading firms, with some entities moderating full-year guidance to reflect the difficult cost environment. This squeeze was exacerbated by supply chain disruptions and ongoing wage inflation, which combined to erode operating leverage. Price realization challenges were further compounded by a growing trend of consumers trading down to lower-priced alternatives, amplifying revenue-side pressures. Consequently, these cost and demand side headwinds contributed to the downward revisions and muted earnings growth in the staples sector.
Communication Services Sector: Advertising Revenue Declines and Competitive Challenges
Communication services experienced adverse earnings impacts stemming from an ongoing decline in traditional advertising revenues during Q1 2026. The sector saw a double-digit contraction in U.S. linear TV advertising and overall ad sales, reflecting structural secular shifts and a cautious advertiser environment.
While digital streaming platforms demonstrated moderate growth, the incremental revenue gains were offset by increased investments and operational costs associated with content expansion and technology upgrades. Intensified competition among digital platforms compounded margin pressures, with advertising spend migration to newer formats not yet sufficient to compensate for legacy declines. The tepid revenue environment, coupled with elevated marketing and sales expenses, drove negative revisions and heightened uncertainty about near-term profitability in this sector.
Zacks Data Empirically Reinforces Sector-Wide Negative Revisions Scale
Empirical data from Zacks Investment Research corroborates the observed downward revision trends, indicating that nine out of sixteen sectors experienced cuts in Q1 earnings estimates, notably including consumer discretionary, staples, and communication services. The declines in analyst expectations have been quantitatively significant, reinforcing the narrative of broad-based vulnerability in these sectors. The Zacks methodology excludes outliers and incorporates updated guidance, lending confidence to the relevance of these revisions as indicators of sector-specific challenges.
This empirical evidence underlines a growing divergence from historically positive earnings momentum in these categories and highlights the increasing risk profile they carry in portfolio contexts. The persistence and scale of negative estimate adjustments serve as a timely signal for more cautious exposure and emphasize the need for active monitoring of evolving consumer behavior and advertising market dynamics.
The vulnerabilities highlighted by these negative surprises contrast sharply with more resilient sectors and underscore the heterogeneous nature of the Q1 2026 earnings landscape. The following sections will integrate these insights into a broader discussion on earnings quality and forward-looking market positioning.
8. Forward Outlook and Market Confidence: Building Sustainable Momentum
Upgraded Consensus Validates Robust 12.6% Q1 Earnings Growth Fueled by Tech, Materials, and Financials
This subsection situates the latest consensus revisions and sector contributions within the broader forward-looking earnings narrative. It serves to ground strategic portfolio considerations in validated growth projections and clarifies the principal drivers sustaining momentum in Q1 2026. By dissecting analyst upgrade patterns, it highlights areas of conviction and underscores the sectors underpinning continued expansion.
Validation of 12.6% Q1 2026 Earnings Growth amid Sustained Double-Digit Expansion
The most current consensus firmly supports an expected 12.6% year-over-year growth in S&P 500 earnings for Q1 2026, marking the sixth consecutive quarter of double-digit earnings expansion. This projection reflects a gradual but resolute increase from estimates made at the start of the quarter, driven predominantly by upward revisions in key sectors and positive early earnings surprises. Despite geopolitical headwinds that have the potential to moderately subtract from growth, the trajectory remains robust, suggesting a strong alignment between market fundamentals and analyst expectations.
Further reinforcing this outlook, companies have issued positive guidance at levels exceeding both five- and ten-year averages. This elevated confidence signals operational resilience and substantiates the expectation that earnings momentum will persist through the quarter. Notably, the blend of maintained and enhanced top-line growth with controlled cost pressures across sectors contributes to sustaining this high-growth environment.
Sector Contributions Driving Earnings Momentum: Tech, Materials, and Financials Lead
The upward earnings forecast for Q1 is largely attributed to substantial gains in the Information Technology, Materials, and Financials sectors. Information Technology stands out with projected earnings growth around 45%, propelled by surging demand for AI-related computing power, semiconductor sales, and cloud infrastructure investments. Within this sector, semiconductor manufacturers exhibit particularly striking growth rates, some approaching or exceeding 90%, underscoring their outsized contribution to the tech segment’s overall performance.
Materials, benefiting from sustained datacenter expansion and rising commodity prices tied to raw materials such as copper and lithium, are expected to deliver roughly 24% earnings growth. This surge reflects the sector’s integral role in supporting infrastructure development and digital transformation trends. Financials maintain steady double-digit earnings growth in the range of 12–15%, driven by a favorable net interest margin environment and cautious credit management, providing a balanced and stable growth pillar within the index. Utilities also nearly reach this threshold, though marginally below, indicating selective strength.
Conversely, sectors such as Energy, Communication Services, and Health Care exhibit more mixed or even contracting earnings expectations, which tempers aggregate growth but remains insufficient to offset the pronounced uptrend established by growth-focused segments.
Analyst Upgrades Reflect Broadening Momentum and Conviction Across Key Sectors
Analyst estimate revisions contribute significantly to the upgraded consensus. Since the beginning of 2026, earnings estimates have been raised notably within Information Technology and Energy sectors, signaling increased confidence in their near-term earnings potential. Such positive revisions in Energy primarily stem from higher oil prices and improved sector-specific fundamentals that have reversed earlier negative outlooks.
At the same time, a majority of sectors demonstrate mixed revision patterns, with several experiencing downward adjustments, particularly in Consumer Discretionary, Health Care, and Communication Services. Nevertheless, the dominant effect of upward revisions in the growth-oriented sectors maintains an overall positive earnings trajectory. This mixed revision landscape highlights the importance of sector-specific analysis and calibration of investment positioning based on evolving fundamentals.
The strength of estimate revisions, combined with elevated positive earnings surprises observed during early releases, supports a narrative of reinforced earnings quality and bolsters confidence in sustained market momentum for the remainder of the quarter.
Having established a firm and upwardly revised earnings growth foundation and identified the leading sectors contributing to this momentum, the report next explores margin trends and operational efficiency to evaluate the sustainability and quality of these earnings gains across industries.
Geopolitical Risks Test Resilience Amid Fundamental Strength and Tech Leadership Recovery
This subsection probes how the ongoing Middle East conflict has shaped sectoral earnings revisions, investor behavior, and overall market confidence during Q1 2026. By dissecting these dynamics alongside the technology sector's guidance and earnings beat patterns, the analysis contextualizes the market's ability to absorb geopolitical uncertainty while sustaining growth narratives. This insight is critical for framing risk assessments and refining strategic portfolio positioning in the face of external shocks.
Middle East Conflict’s Impact on Earnings Revisions and Sector-Level Risk Assessment
The geopolitical tensions stemming from the ongoing conflict in the Middle East have exerted a pronounced yet nuanced influence on 2026 Q1 earnings revisions. While energy producers experienced positive earnings forecast revisions driven by sustained elevated oil prices, particularly Brent crude surpassing $100 per barrel for much of the quarter, several other sectors faced downward pressure amid rising costs and supply disruptions. Major energy companies reported sharp earnings upgrades—Shell’s adjusted Q1 earnings projections surged nearly 50% following price spikes driven by regional supply constraints and heightened demand. These windfall revenues of approximately $8.6 billion underscored the immediate financial benefits captured by upstream energy firms despite operational challenges due to damaged facilities and geopolitical risks.
Conversely, sectors with indirect exposure to the conflict such as industrials, consumer discretionary, and automotive reported earnings headwinds. For example, an industrial equipment manufacturer revealed $54 million in revenue losses and $32 million in EBITDA reductions linked to deferred sales and increased freight costs caused by logistical disruptions. Automakers similarly flagged significant margin compression attributable to tariffs and elevated input costs exacerbated by the conflict and its broader economic fallout. A notable theme across these affected sectors is the incorporation of conservative assumptions into forward guidance, as firms embed war-related uncertainties and supply chain risks into their outlooks, reflecting a cautious stance despite a generally strong start to the year.
Investor Sentiment Realignment and Market Confidence Under Geopolitical Uncertainty
Investor sentiment in Q1 2026 demonstrated notable resilience despite the heightened geopolitical risks. Initial market reactions to the conflict included discernible risk-off behavior characterized by increased volatility and reallocations toward safe-haven assets such as gold and the US dollar. Institutional investors exhibited increased vigilance, tempering earnings upgrade enthusiasm and exercising caution in forecasting, particularly among companies with direct or supply-chain exposure to the conflict. However, this risk aversion was largely balanced by a reengagement with fundamental drivers of growth, which fostered a gradual realignment of market confidence with corporate performance metrics rather than purely geopolitical sentiment.
Global stock indices showed a bifurcated response; while regional markets proximate to the conflict zone experienced sharper declines and volatility spikes, major diversified international indices, including the S&P 500, rebounded swiftly as earnings beats and robust Q1 forward guidance emerged. This underscores a market increasingly adept at differentiating transient geopolitical shocks from underlying earnings strength. Sectoral rotation favored growth-anchored and secular themes, notably within technology, as investors sought durable drivers capable of withstanding external shocks. The sustained high beat rates and strong operating momentum among healthcare and financials further underpinned this confidence, albeit tempered by lingering uncertainties in consumer discretionary and communication services.
Technology Sector’s Forward Guidance and Beat Rates as Indicators of Recovery Potential
The technology sector’s Q1 2026 earnings season epitomized the complex interplay between extraordinary growth potential and elevated expectations amidst geopolitical uncertainty. Driven by robust AI infrastructure investments and cloud computing expansion, tech firms delivered an exceptional approximately 45% earnings growth, rebounding from an extended losing streak early in the year. This performance not only fortified the sector’s narrative but also served as a market bellwether for overall optimism about the sustainability of secular growth drivers despite external risks.
However, the sector displayed mixed earnings surprise outcomes due to the elevated bar set by analysts, with some companies narrowly missing forecasts in spite of top-line strength. Forward guidance from leading semiconductor and AI-related firms indicated cautious optimism, reflecting heightened vigilance around supply chain stability and potential conflict escalation. This balanced messaging suggests that while investor enthusiasm for the tech sector’s prospects has materially improved, risk remains elevated, necessitating close monitoring of geopolitical developments. The high-quality earnings and guidance robustness position the technology sector as pivotal to restoring market leadership and sustaining momentum through 2026.
Operational margin trends further emphasize the technology sector’s profitability leadership, with technology companies averaging a robust 29.1% operational margin in Q1 2026—more than double that of peers such as Financials (13.2%) and Energy (6.6%), and significantly ahead of Communication Services (14.1%). This margin strength underpins the sector’s earnings momentum and resilience amid external challenges, highlighting operational efficiency as a key driver of sustained growth and investor confidence.
Operational margins across various sectors and how they compare within the market context.
Taken together, these observations affirm that despite the disruptive backdrop of geopolitical conflict, the fundamental strength of key growth sectors, particularly technology and energy, has fostered resilience and a cautious return of investor confidence. This complex dynamic highlights the critical importance of nuanced sectoral analysis and selective risk management approaches in portfolio construction as markets navigate an environment marked by both uncertainty and opportunity.
Conclusion
The Q1 2026 earnings season distinctly highlights the ascendancy of technology and materials sectors as dominant contributors driving robust double-digit growth within the S&P 500. Fueled by transformative advancements in artificial intelligence, cloud computing, and sustained infrastructure investments, these sectors achieved exceptional revenue and margin expansion, underscoring their pivotal role in propelling overall index earnings upward. Companies like Micron Technology and Teck Resources provided compelling exemplars of operational excellence and strategic positioning amid accelerating secular trends.
At the same time, traditional defensive sectors, including healthcare, financials, consumer staples, and energy, illustrated a more nuanced performance profile. While healthcare and financials maintained stable earnings beat rates and consistent revenue growth, energy and consumer discretionary grappled with margin compressions driven by elevated input costs and geopolitical risks, including the Middle East conflict’s disruption of oil supply chains. The resulting sectoral divergence translates into a differentiated risk and return landscape requiring tactful portfolio calibration.
This bifurcation carries broad implications for market participants. The demonstrated dominance of cyclical, innovation-led sectors affirms the necessity of emphasizing growth areas—particularly technology and materials—within tactical equity allocations. Conversely, defensive sectors’ valuation saturation and constrained upside highlight the need for cautious engagement, ensuring portfolio resilience without sacrificing return potential.
Looking forward, the reinforced consensus projecting approximately 12.6% year-over-year earnings growth, supported by sustained positive analyst revisions and elevated earnings surprises, offers reason for cautious optimism. However, vigilance remains essential as geopolitical uncertainties and inflationary pressures present ongoing risks. Investors are advised to monitor supply chain developments, cost inflation trajectories, and sectoral execution closely.
Ultimately, Q1 2026 results validate a strategic market narrative centered on technology-enabled disruption and infrastructure-driven expansion as key earnings catalysts. Balancing these growth themes with measured defensive exposures will be critical for navigating the evolving market landscape in the months ahead.
References
- Rebalancing portfolios for a more sustainable cycle | Barclays Private Bank
- Energy and Other Sectors Drive Earnings Estimates Higher
- Utilities Sector Earnings & Financial Results | Most Recent Quarter
- Energy Sector Earnings & Financial Results | Most Recent Quarter
- Nike, Oracle, FedEx are part of Zacks Earnings Preview
- PDF Quarterly Sector and Investment Research Update | Q2 2026 | Fidelity ...
- estimated - FactSet Earnings Insight
- TECK Q1 2026 News Release
- Forget Geopolitics: Bet on Earnings Growth & Invest in These Sector ETFs
- Amazon, Alphabet, Microsoft, Meta and Apple are part of Zacks Earnings Preview - The Globe and Mail
- Healthcare Sector Earnings & Financial Results | Most Recent Quarter
- Technology Sector Earnings & Financial Results | Most Recent Quarter
- Citi: Q1 2026 US Equity Earnings Outlook - Tech Sector Earnings Surprises Lead
- Analyzing the Energy Sector's Strong Earnings Outlook
- AI Surge Drives Memory Chip Demand to New Heights
- Q1 earnings picture mixed as cost pressures persist
- Industrials Sector Earnings & Financial Results | Most Recent Quarter
- Wall Street loses momentum? 🚩 Highlights from the S&P 500 earnings season
- PDF PERSPECTIVES - Deutsche Bank
- What’s the earnings outlook for the first quarter of 2026?
- Earnings Insight
- Q1 Earnings Season to Gain Momentum: What Will it Show?
- S&P 500 Earnings Season Preview: Q1 2026
- S&P 500 Earnings Season Q1 2026: Why This Quarter Could Spark a Rally | TradingMarketSignals
- Anticipating the Q1 Earnings Season for 2026 - WallStreet Waves
- Looking Ahead to the 2026 Q1 Earnings Season
- Mag 7 Earnings on Deck: AI Monetization and Leadership Transitions Take Center Stage this Week
- Daily market snapshot
- Key charts to help identify current sector trends
- What’s the earnings outlook for the first quarter of 2026?
- Energy and Other Sectors Drive Earnings Estimates Higher
- Resilience in Action: Diverse Corporate Strategies Validating Economic Durability in Q1 2026 S&P 500 Earnings
- Q1 2026 Earnings Outlook: Sectoral Divergence, AI-Powered Tech Leadership, and Strategic Market Positioning
- Q1 2026 Earnings Season: Navigating Resilience Amid Geopolitical Volatility and Sectoral Divergence
- Mixed Signals in the Profit Tapestry: Decoding the Q1 2026 Earnings Landscape
- Q1 2026 Earnings Insights: Divergent Sector Dynamics Amid Geopolitical Turbulence and Market Rotation
- Can higher oil prices negate damage to Qatari gas plant for Shell?
- What to Expect From These 4 Energy Stocks This Earnings Season?
- Financial Results for the year ended December 31, 2025
- How the Iran war boosted profits at BP and Barclays
- Consumer Cyclical Sector Earnings & Financial Results | Most Recent Quarter
- What’s the earnings outlook for the first quarter of 2026?
- Q1 2026 EARNINGS RELEASE CALL
- Wall Street loses momentum? 🚩 Highlights from the S&P 500 earnings season
- Thermo Fisher Scientific Reports First Quarter 2026 Results
- Earnings Outlook Remains Very Strong: A Closer Look
- US Q1 earnings: can 13% growth survive geopolitical headwinds?
- Production Forecasts for the Global Electronics and ...
- PDF Q1 2026 - d21buns5ku92am.cloudfront.net
- Financial Markets in 2026
- IT sector: How is AI spending reshaping budgets – Kotak decodes
- First Trust Market Commentary Blog - Cash Flow and Carey
- Sector Market Perspectives: Q2 2026 | State Street
- Technology Sector Earnings & Financial Results | Most Recent Quarter
- Broad-Based Earnings Growth Expected in 2026
- CVS Health (NYSE:CVS) Delivers Impressive Q1 CY2026
- Sotera Health Company’s (NASDAQ:SHC) Q1 CY2026: Beats On Revenue, Stock Soars
- Universal Health Services (NYSE:UHS) Beats Q1 CY2026 Sales Expectations
- HCA Healthcare Inc (HCA) Q1 2026 Earnings Call Highlights: Strong Revenue Growth Amid ...
- HCA Healthcare Reports First Quarter 2026 Results
- CHE Q1 Deep Dive: VITAS Drives Growth, Roto-Rooter Adapts to Higher Marketing Costs
- UnitedHealth raises 2026 profit outlook after Q1 earnings beat
- UnitedHealth’s (NYSE:UNH) Q1 CY2026: Beats On Revenue, Stock Soars
- How to maximize AI ROI in 2026 | IBM
- Artificial Intelligence – Bubble or Boom?
- PDF EMERGING TECH RESEARCH SaaS Is Dead, Long Live SaS
- The geography of AI firms
- Impact of AI on Quarterly Earnings in Tech
- 2026 US Equity Outlook Great Potential
- PDF Artificial Intelligence, Productivity, and the Workforce: Evidence from ...
- Target date strategies: Navigating uncertainty with a long-term ...
- PDF Artificial Intelligence and Monetary Policy: A Framework and ...
- Investment Directions | BlackRock
- Is AI a smart investment? Exploring growth stocks, risks, and ethical concerns
- AI Neutrality
- The Role of Artificial Intelligence in Cloud Computing: Transforming the Future of Technology | HooYia: Your Trusted IT Partner in Cameroon
- AI Market 2026: The Complete Industry Analysis with Data, Trends and Forecasts - Fungies.io
- The impact of Artificial Intelligence on businesses. The case of ...
- Digital Transformation Market Size | Industry Report, 2030
- The Synergy of AI and Cloud Computing | Tech Mahindra
- PDF Business Analysis: A Comparative Analysis of AMD and NVIDIA
- The Role of Artificial Intelligence in Cloud Computing: Transforming the Future of Technology | HooYia : Votre partenaire informatique de confiance au Cameroun
- [PDF] AI Neutrality - Vanderbilt University
- PDF Middle East Escalation 4212026 - gbta.org
- PDF Geopolitical Conflict and Global Economy: A Study of the Long-Term ...
- PDF BIS Quarterly Review
- PDF Gas Market Report, Q2-2026
- PDF Market forecasts Forecasts Q2 2026 - ssga.com
- Time.now
- PDF UKRAINE Thematic eport 2 pri 026 Impacts of the 2026 Middle East conflict
- Middle East conflict challenges Asia-Pacific resilience: ADB -Xinhua
- Iran War Timeline 2026: Every Major Event from February 28 to Today
- Strategic Research Institute - SRI
- PDF Decoding the Indian Economy FY2026 - assets.kpmg.com
- PDF Navigating the New Economy: The sectoral and regional effects of GenAI
- PDF Economic and Fiscal Update Supplement to The 2024-2025 Budget Address
- PDF ETHIOPIA HOMEGROWN ECONOMIC REFORM 2 - Shega
- PDF Diagnosing Excess Bank Liquidity and Economic Underfinancing in Algeria ...
- 54th ANNUAL REPORT 2014
- “Middle-Income Trap”; the position of Algerian economy
- Algeria
- FICCI pegs India’s 2024-25 GDP growth at 6.4%, retail inflation at 4.8%
- Micron Rockets 12%, SanDisk Leaps 10% as Tight Memory Supply Fuels Parabolic AI Trade
- ‘DRAM Will Double or Triple From Here’ as AI Demand Outpaces Supply Chain Capacity
- Micron Technology, Inc. Reports Results for the First Quarter of Fiscal 2026
- Barron's Said Micron Was the Cheapest Stock in America. The Skeptics Were Wrong.
- The Artificial Intelligence (AI) Hype Is Fading, and That's Creating the Best Buying Opportunity of 2026 | The Motley Fool
- MU Stock Eyeing All Time Highs as Samsung Earnings "Confirm" the Memory Demand
- Memory Stocks Jump on Tuesday: SanDisk, Micron See Strong Gains Again
- Comparative Market Performance of SanDisk and Micron
- Micron's Stock Surge Raises Bubble Concerns
- Micron Technology (NasdaqGS:MU) Stock Forecast & Analyst Predictions - Simply Wall St
- PDF The Historic Relationship between bank net interest margins and ... - FDIC
- Banking Sector Performance during two periods of sharply ...
- Empirical test based on banking panel threshold model
- Semiannual Performance Report
- PDF Quarterly sector and investment research update - Fidelity Investments
- PDF A Study On Utilisation And Satisfaction Of Personal Loan Among Salaried Employees - IJCRT
- The P/E Ratio: A User's Manual
- [PDF] Republic of Tunisia Country Economic Memorandum
- [PDF] Algeria: Financial System Stability Assessment
- [PDF] https://theses.gla.ac.uk/ Theses Digitisation: This is a digitised ...
- PDF Half-Built Britain: Unlocking the nation's infrastructure growth plans
- Infrastructure spending declines in February - BusinessWorld Online
- INVESTOR PRESENTATION
- PDF 2026 Quarterly Report for First Quarter of 2026
- GDP (Advance Estimate), 1st Quarter 2026 | U.S. Bureau of Economic Analysis (BEA)
- PDF Presentation - teck.com
- Micron Semiconductor Manufacturing Project - DEIS
- Climate Adaptation and Resilience Financing
- Germany ramps up transport upgrades (as of 21 August 2025)
- PDF The Influence of Income Diversification and External Risk on Financial ...
- PDF Banks' net interest margins and interest rate ... - De Nederlandsche Bank
- Banking in Africa: financing transformation amid uncertainty
- woori
- KB Financial Q1 2026 slides: non-interest income surge powers profit gain By Investing.com
- PDF Quarterly Banking Profile - 1st Quarter 2023 - FDIC
- RUSSIAN FINANCIAL MARKET DEVELOPMENT ...
- PDF Risk Review 2025 - FDIC
- ICICI Bank seen posting healthy Q3 PAT on stable NIM, healthy business growth
- PDF S&P 500 Q2 2024 Quarterly Earnings Analysis - consello.com
- PDF REIT market perspectives December 2025 - brandassets.principal.com
- 4 Industrial Stocks Set to Outshine Q1 Earnings Estimates
- PDF S&P 500 Q1 2025 Quarterly Earnings Analysis - consello.com
- S&P 500 Earnings Season Update: April 24, 2026
- S&P 500 Energy and Utilities Sectors Earnings Previews: Q1 2026
- PDF World Energy Outlook 2023
- Commodity Price Risk and Material Scarcity: An Escalating and Complex Risk | Global Risk Management Survey
- Morocco's Central Bank response to geopolitical shocks ...
- Geopolitical Risks and Their Impact on Global Macro- ...
- PDF The Impact of Geopolitical Risks on Equity Markets and Financial Stress ...
- Understanding Geopolitical Risk in Investments | MSCI
- Impact of geopolitical risk on the information technology, ...
- PDF Quantile-based assessment of investor sentiment, uncertainty and ...
- Geopolitical risks and their impact on global macro
- Geopolitical Tensions and Global Electoral Landscapes: Key Events and Analysis
- PDF st Quarter 2026 Guide to the Gauges - ccmg.com
- PDF Investment Strategy Insights - assets.pinebridge.com
- Apple Inc. (AAPL) down 0.2% in 2026 $271.06 - buy sell signal
- PDF Sector Ratings for ETFs & Mutual Funds - newconstructs.com
- PDF 1Q26 ETF & Mutual Fund Sector Ratings Recap - newconstructs.com
- PDF S&P 500 Q1 Total Return −4. - myspg.com
- Strong performance in banks, industrials and transport lifts QSE index to 10,346 level | The Peninsula Qatar
- Luxury Shares Slide As China Demand Softens, Investors Eye Sector's Outlook | IBTimes
- Teck Resources Limited (TECK) Announces Unaudited Q1 2026 Results
- How Record Q1 Copper Profitability And Dividend Move At Teck Resources (TSX:TECK.B) Has Changed Its Investment Story
- TECK's Q1 Earnings Top Estimates on Record Copper Sales & Strong Pricing
- Teck Resources Ltd (TECK) Q1 2026 Earnings Call Highlights: Record Copper Sales and Doubling of ...
- Teck Resources Q1 Earnings Call Highlights
- Teck Resources Limited Q1 2026 Earnings Call Summary
- Texas Instruments signals a stronger recovery on industrial and AI demand
- 4 Canadian Copper Stocks That Can Quickly Respond to Falling Inflation | The Motley Fool Canada
- A Strong and Steadily Improving Earnings Picture
- Big Tech's Blockbuster Q1 2026: Meta, Texas Instruments Lead a Stunning Earnings Season
- American Express, Tesla and Halliburton are part of Zacks Earnings Preview
- GraphRAG: Leveraging Graph-Based Efficiency to ...
- Establish benchmarks for comparing industrial returns | HelloLandMark
- PDF Evaluating the Financial Performance of Pension Funds
- The ASEAN Way : Sustaining Growth and Stability
- PDF Evolution of Automation to Hyperautomation: Leveraging RPA, AI ML, NLP ...
- PDF Financial Performance Metrics: Assessing and Improving Organizational ...
- PDF Financial Liberalization: Managing Risks and Opportunities
- PDF Banking Performance Management: Three ways banks are winning with ... - IBM
- PDF Evaluation of Performance of Malaysian Banks in Risk Adjusted Return on ...
- PDF Market regimes, sectorial investments, and time-varying risk premiums
- Sector & sub-industry ETFs
- PDF PAVE - assets.globalxetfs.com
- PDF Corporate Earnings Monitor Q1 2025 - imfconnect.org
- Largest Technology ETFs
- Best Tech ETFs 2025: AI-Powered Analysis of Top 7 Technology Funds for Investors - Shipra
- Senior Investment Analyst: ETF Analysis Guide
- ARKK: 3 AI ETFs Leading the Next Investment Revolution | StockNews.com
- 3 AI ETFs Leading the Next Investment Revolution
- Top 10 High-Flying Tech ETFs for Investors in 2024
- Can higher oil prices negate damage to Qatari gas plant for Shell?
- NOV (NOV) Q1 2026 Earnings Call Transcript | The Motley Fool
- JPMorgan Says Firms Avoid Raising Forecasts Due to War Concerns
- Iran War Ripples Hit Hyundai, ServiceNow, Heineken Earnings
- A quarter of two halves
- Global economy under test amid uncertain Middle East crisis - CGTN
- Middle East conflict reshapes outlook for Russia’s oil revenues: Kyiv | Shipping reports | Shipping Telegraph
- PDF The 2026 Conflict in the Middle East and Macroeconomic Risks for Asia and the Pacific ...
- PDF Economic impact of the Middle East conflict
- KOSPI Breaks 7,000: AI-Driven Semiconductor Surge Redefines South Korea’s Market Landscape
- Q1 2026 Strategic Sectoral Review: Industrial Resilience, Healthcare Stability, AI Expansion, and Automotive Innovation
- AI-Driven Transformation and Sectoral Dynamics: A Comprehensive Analysis of Q1 2026 Financial Performance and Strategic Outlook
- Q1 2026 Earnings Preview: AI-Driven Tech Growth, Energy Volatility, and Healthcare Resilience Amid Geopolitical Uncertainty
- US Artificial Intelligence (AI) in Semiconductor Market - Strategic Insights and Forecasts (2026-2031)
- AI drives semiconductor revenues past $1 trillion for the first time in 2026
- Q1 2026 Semiconductor Demand Surge & Lead Time Outlook
- Gartner projects global semiconductor revenues to top $1.3 trillion in 2026 - New Electronics
- Global chip sales expect to top US$1 trillion in 2026 on AI demand
- Semiconductor Demand Rises at Record Pace in Q1, Portending Booming Growth in 2026 - Findchips Blog
- HCA Q1 Deep Dive: Lower Seasonal Volumes and Shifting Payer Mix Weigh on Outlook
- FactSet Earnings Insight
- UHG Earnings Q1 2026: Revenue, EPS & Key Takeaways
- Mid-cap healthcare stocks with A grade EPS revisions ahead of earnings (XLV:NYSEARCA)
- PDF Institutional Ownership Concentration and Informational Efficiency
- PDF The Effects of Quantitative Easing: National Bureau of Economic ...
- PDF PEAD.txt: Post-Earnings-Announcement Drift Using Text
- The Growing Importance of Financial Spillovers from ...
- Are Short-selling Restrictions Effective?
- Evaluating Stock Selection in the SaaS Industry
- FORM 10-Q
- PDF Working Paper Series - European Central Bank
- PDF BII Global outlook
- Divergent Dynamics: Analyzing Sectoral Disparities in Q1 2026 Corporate Earnings Amid Geopolitical and Technological Transformations
- Economic Policy Statements to TBAC: 2026 - 2nd Quarter
- PDF The Impact of Domain-Specic Terminology on Machine Translation for Finance in European ...
- Q1 2026 Earnings Insights: Strategic Breakthroughs and Sectoral Shifts Shaping Competitive Landscapes
- Navigating the Q1 2026 Economic Crossroads: Corporate Earnings Resilience Amid Federal Reserve Policy and Geopolitical Volatility
- Strong Tech Earnings Highlight AI-Driven Market Momentum Amid Varying Growth Challenges
- Q1 2026 Market commentary
- PDF Investment Outlook - rockstead.com
- What the (latest) Middle East conflict means for inflation, growth, and monetary policy in Europe
- Nigeria: Manufacturing Output Declines As Higher Fuel Costs Slow Growth - Report - allAfrica.com
- Bitcoin's Breakout Rally and Coinbase’s AI-Driven Strategic Evolution: Institutional Momentum and Technological Transformation in 2026
- PDF Geopolitical Risk Premium: Pricing Volatility in 2026
- The Zacks Analyst Blog Highlights GUSH, ERX, DRIP, DIG and OILU
- Bet on Leveraged Energy ETFs on Extended Iran Blockade Worries
- From Headlines to Hard Data: Iran and the Energy Markets
- Three ETFs that will be impacted by the closure of the Strait of Hormuz. Should you buy?
- 4 Energy Stocks to Buy as Geopolitics Reshapes Global Markets
- Top ETF Picks for April 2026 (War-Adjusted Portfolio Strategy)
- Tech, Energy, and Crypto ETFs Ignite US Market, Fueling Growth and Transformation | Salt Lake City News, Weather, Sports, Breaking News | KUTV
- Navigating Global Uncertainty: Examining the Effect of Geopolitical Risks on Cryptocurrency Prices and Volatility in a Markov-Switching Vector Autoregressive Model
- Navigating Market Volatility Amid Middle East Geopolitical Risks and the Accelerating AI Semiconductor Revolution
- PDF AI-Driven Predictive Maintenance for Energy Infrastructure
- PDF Power Sector Cost-Benefit Analysis Design Principles
- PDF Energy Economic and Environmental Assessment of U.s. Lng Exports
- PDF Fiscal and macroprudential policies during an energy crisis
- Economic Estimation of a Green Ammonia Production ...
- Virginia Tech Board of Visitors Meeting March 21-22, 2010
- Queensland’s Economic Pressures, Childcare Crisis, and AFL Season Update: A 2026 Status Report
- Jordan Water Sector Efficiency Project - World Bank Document
- Thunder Power Reports 253% Higher Losses, Moves to OTC Markets After NASDAQ Exit
- Strategic Insights into Asian Tech Growth, Middle East Market Resilience, and Asia-Europe Undervalued Stocks
- Geopolitical Tension's Impact on Indian Economy. - RADIANCE STOCK ANALYZER – 🤖 AI Powered Stock Market Analysis & Financial Insights 📊
- PDF Hong Kong Asset Management and Private Equity Outlook
- Geopolitical Shockwaves: West Asia Conflict Wipes Out Rs 23.44 Lakh Crore from Indian Equity Markets | TopNews United States
- Macroeconomic and financial impact of conflicts: a study of the ...
- Navigating India's Equity Markets Amid Geopolitical Tensions 🌍📉
- Energy Markets: Navigating a 10% Oil Price Surge Amid Israel-Iran Tensions
- S&P 500 Faces Pressure Amid Geopolitical Tensions and US Economic Uncertainty – Market
- PGIM survey: Investors to continue risk-on appetite in 2025, despite geopolitical uncertainty
- PDF Q1 2026 - ENG - PR + Activity Report - airliquide.com
- PDF On corporate margins and inflation rates - Invesco
- Q1 2026 Earnings Snapshot: Divergent Paths of UL Solutions, Shoals, and Energy Sector Leaders Amid Growth and Volatility
- Appendix A: Costing Methods
- Utility CEOs pocket $626 million as American energy bills hit record highs | Fortune
- PDF REPORT 2026 - sandhill.com
- 2025ar.pdf
- Understanding industry profit margins: benchmarks, formulas and strategies
- Gross Margin vs Operating Margin — Vintti
- How macroeconomic variables impact sector performance
- Momentum Review: Sectors & Industries (May 2025 Edition)
- The Biotech Growth Trust
- 5 Strategies to Navigate Market Volatility | Morgan Stanley
- PDF Sector business cycle analysis - SSGA
- DIA: State Street® SPDR® Dow Jones Industrial Average® ETF Trust
- PDF Performance and Risk of The Us-listed Asia Pacific Exchange Traded Funds
- The 12 Best Bear Market ETFs to Buy Now (2026)
- John Hancock ETFs
- Margin compression squeezes corporate earnings
- PDF Consumer Staples & Discretionary
- Marico, Radico Khaitan in focus as FMCG navigates inflation-led challenges - The Economic Times
- Consumer Goods Market Size, Share, Trends & Forecast [2034]
- India's FMCG cos set for demand recovery in Q4
- Calm Q4 earnings may hide storm from war-led costs
- Margin Survival Strategies for Consumer Products Leaders
- Consumer durables face margin pressure despite steady Q4FY26 growth outlook
- Indian FMCG companies signal possible price hikes ...
- PDF Diversification By the Numbers
- PDF PERSPECTIVES - wealth.db.com
- Time to Upgrade Your Defence? | Man Group
- Cyclical stocks: what are they and why you should care
- PDF Strategic Sector Selector Trav & Leis Implied dividend growth ... - Invesco
- Sector Analysis: How Industry Trends Impact Company Performance | Wealthsimple
- Types of stocks in the stock market: A comprehensive guide for beginners
- Key charts to help identify current sector trends
- PDF Q1 2026 MDA - cdn.propelholdings.com
- QSE listed companies record QR12.763bn net profit in first quarter | The Peninsula Qatar
- Aecon reports first quarter 2026 results with record backlog of $10.9 billion
- 4 Industrial Stocks Set to Outshine Q1 Earnings Estimates
- Industrials Industry Report - Q1 2026
- China's industrial output records faster expansion in Q1-Xinhua
- UL Solutions Inc. R (72R.DU) Q4 FY2025 earnings call transcript
- Q1 2026 Sectoral Earnings Analysis: Divergence, Digital Transformation, and Strategic Outlook Across Industrial, Healthcare, and Mining Sectors
- Resilient Growth Amidst Fragmented Signals: A Strategic Analysis of Q1 2026 Corporate Earnings and Sectoral Divergence
- PDF Consumer Staples Sector Report 2023-24 - trinitysmf.com
- PDF Effects of Macroeconomic Variables on Consumer Staples and Consumer ...
- Consumer Spending Trends in CPG: Economic Impact Analysis - Wiss
- Navigating Turbulence with Innovation: Q1 2026 Sectoral Resilience in Pharmaceuticals, Cruise Lines, and Heavy Equipment
- PDF Impact of global events on prices in India (2022-2025)
- West Asia war: As RBI holds the rupee, how India Inc. is feeling the strain - India Today
- PDF Federal Communications Commission FCC 23-117 Before the Federal ...
- PDF Nos. 24-1380, 1480, 1493, 1516 - National Association of Broadcasters
- WPP revenue falls as Elevate28 push continues - Mediaweek
- World Bank Document
- PDF LOCAL JOURNALISM - U.S. Government Accountability Office (U.S. GAO)
- PDF Local Journalism
- FactSet Earnings Insight
- Canadian Telecommunications Market Report 2025 | CRTC
- (MM) Stock Price - JDSU | ADVFN
- Kakao Reports Strong Profit Growth Despite Declining Sales
- Five Star (FSBC) Q1 2026 Earnings Transcript
- PDF Exhibit 99.1 Earnings Release 04 - Valley Bank
- Exhibit 99.1 Earnings Release 04.23.2026
- Financial Institutions, Inc. Reports Net Income Available to Common Shareholders of $20.6 million, or $1.04 per Diluted Share, for the First Quarter of 2026
- WAL Q1 2026 Earnings Presentation
- West Coast Community Bancorp Announces Earnings and Dividend for the First Quarter of 2026
- Regions (RF) Q1 2026 Earnings Call Transcript | The Motley Fool
- Entravision Communications Q1 Earnings Call Highlights
- PDF SoftBank Corp. Investor Briefing Earnings Results for the Fiscal Year ...
- Future of TV Briefing: The upfront glossary, 2026 edition - Digiday
- PDF 0001639920-25-000003
- Stagwell (STGW) Q1 2026 Earnings Transcript
- TF1 Q1 revenue down 9.3%
- TelevisaUnivision Q1: Ads Sink 12% Overall, Streaming Ad Growth
- PDF Internet Advertising Revenue
- Naver Corp Q1-2025 Earnings Call
- Market Volatility, Unwelcome Oil Price Shock, and Why Staying Invested Matters
- PDF GenTrust 2026 Outlook
- S&P 500 at 7,000? 2026 Q1 Earnings & Macro Analysis
- What Q1 Earnings Could Mean for the S&P 500 Uptrend | Investing.com
- Energy and other sectors lift S&P 500 Q1 2026 earnings 12%, revenue 8.6%, after prior gains - VT Markets
- Q4 Earnings: AI CapEx and Revenue Trends
- PDF Zacks Data Can Be Used to Empirically Analyze Analysts' Forecasts and ...
- Nyxoah SA (NYXH) May Report Negative Earnings: Know the Trend Ahead of Next Week's Release
- Valuing Firms with Negative Earnings
- 2026 Year-Ahead Outlook
- What Can Investors Expect from Bank Earnings?
- 3 Stocks to Watch From the Satellite and Communication Industry
- ATI Q1 Earnings Beat Estimates on Robust Demand, Revenues Miss
- Intel's Stock Soars Nearly 260%, Future Outlook Worrisome
- Mixed but Promising Trends in Cryptocurrency and Quantum Computing: Early May 2026 Market Analysis
- JPMorgan Announces Dividends for Multiple ETFs, Up to $0.47 per Share
- How AI, Logistics Disruption, and Tech Market Dynamics are Shaping Investor Sentiment in 2026
- Mixed Q1 Earnings and Cautious Outlooks Mark Varied Sector Performances in Early 2026
- PDF Cytonn Q1'2026 Markets Review Executive Summary: Global Markets Review ...
- The Short and Long: Q1 2026
- Institutional Investors Lower 2026 Return Expectations Amid Geopolitical Risks
- PDF Macroeconomic Highlights Q1 2026 - advisor.vcm.com
- Emerging AI and Quantum Computing in 2026: Innovations, Security, and Market Dynamics
- Goldman Sachs, LVMH, and Tech Stocks Navigate Geopolitical Risks Amid Mixed Q1 Results and Market Uncertainties