Navigating Divergent Growth: Q1 2026 Earnings Diagnostics and Strategic Imperatives Amid Macroeconomic and Geopolitical Shifts
Table of Contents
- Executive Summary
- Introduction
- 1. Diagnosing Q1 2026: A Tale of Divergent Growth Trajectories
- 2. Decoding Drivers: Margins, Innovation, and Cost Pressures
- 3. Risk Assessment: Geopolitical Shadows and Currency Crosscurrents
- 4. Strategic Pathways: From Diagnosis to Actionable Intelligence
- 5. Regional Spotlight: Emerging Opportunities and Threats
- 6. Synthesis and Forward-Looking Framework
- Conclusion
Executive Summary
The first quarter of 2026 exhibited a continuation of robust earnings growth across the S&P 500, with earnings per share (EPS) expanding by 12.6% year-over-year and total revenues rising 13%, marking the sixth consecutive quarter of sustained double-digit growth. However, this overall expansion masked pronounced sectoral and regional disparities. The Information Technology sector led margin expansion with a record 28.9% net profit margin supported by substantial R&D investment (14% of revenues) and widespread AI adoption catalyzing a 40-45% annualized earnings growth within the sector. Conversely, the consumer discretionary segment contracted 10.4% year-over-year, reflecting demand normalization and cautious sentiment under inflationary pressures. Financials, particularly private banks, faced persistent net interest margin compression of 15-25 basis points, constraining profit growth amid rising funding costs and soft credit demand. Regionally, ASEAN markets outperformed driven by resilient domestic consumption, with Vietnam posting a 7.83% GDP growth and Singapore’s real estate and telecom sectors rebounding, while the Middle East-Africa region encountered a 5.1% revenue contraction due to geopolitical disruptions.
In the face of geopolitical risks such as Middle East instability impacting energy prices and U.S. tariffs affecting Chinese electronics exports, firms employed rigorous profit-and-loss discipline to mitigate margin erosion. Monte Carlo simulations underscore portfolio sensitivity to sectoral shifts, advocating for scenario-based allocations favoring technology and cyclicals balanced by defensive exposures. Strategic imperatives emerging include accelerated AI and cloud investments exceeding $650 billion annually, operational agility through modular IT modernization, and enhanced governance via weekly KPI dashboards and climate and cybersecurity disclosures. These findings establish a forward-looking framework to embed real-time earnings intelligence into dynamic decision-making, ensuring resilience amid ongoing macro-financial volatility.
Introduction
The first quarter of 2026 unfolded against a backdrop of pronounced global economic complexity, marked by divergent sectoral trajectories, intensifying geopolitical tensions, and evolving technological landscapes. While broad market indices continued to reflect earnings expansion, the underlying narrative reveals a multifaceted earnings environment shaped by region-specific dynamics, inflationary pressures, and disruptive innovation forces. This nuanced earnings context challenges conventional one-size-fits-all investment approaches and mandates a more discerning analysis of sectoral and regional performance drivers.
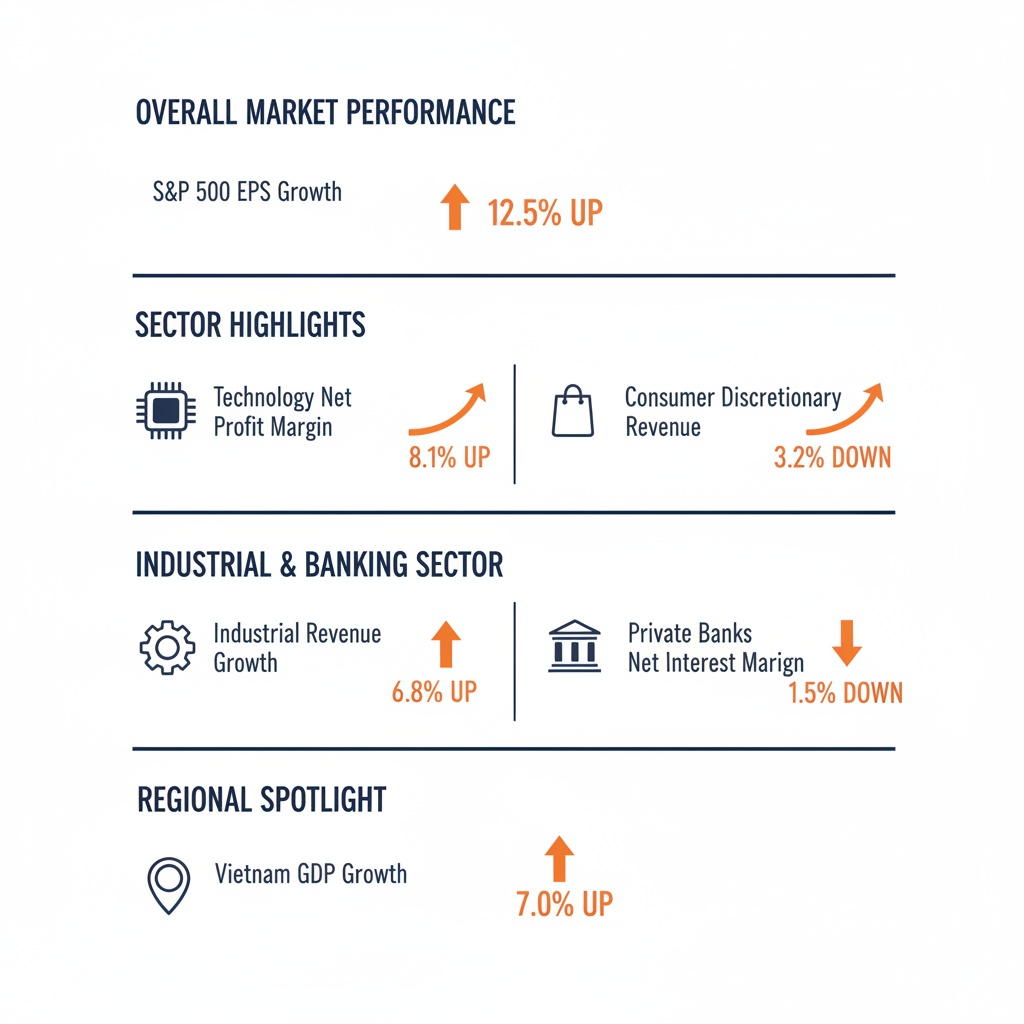
Infographic Image: Q1 2026 Corporate Earnings: Divergent Growth and Strategic Resilience
At the macroeconomic level, sustained momentum in U.S. corporate earnings—highlighted by a 12.6% year-over-year EPS growth—and steady revenue increases contrasted with uneven outcomes in Europe, Asia-Pacific, and emerging markets. These patterns reflect differing consumption models, currency fluctuations, and exposure to geopolitical shocks, such as the prolonged Middle East conflicts and trade frictions impacting supply chains. Against this complex tapestry, technological innovation, particularly in AI and cloud computing, emerged as a critical catalyst for margin expansion and earnings surprises in the Information Technology sector, while legacy industries and consumer sectors contended with normalization and cost headwinds.
The purpose of this report is to provide a comprehensive diagnostic of Q1 2026 earnings performance, dissecting the interplay between macroeconomic conditions, sector-specific forces, and risk factors that collectively influence corporate profitability and investor sentiment. By integrating financial metrics such as margin resilience, earnings surprise distributions, and cost pressures with regional and geopolitical analyses, we aim to furnish strategic insights that enable portfolio managers and corporate leaders to align asset allocation and operational strategies with emergent market realities.
Our scope encompasses a deep dive into critical sectors—technology, industrials, financials, and consumer discretionary—alongside regional spotlights on ASEAN markets and energy transition plays. Further, we assess the implications of currency volatility and geopolitical risks on earnings quality, embedding these findings within scenario-based portfolio construction frameworks and governance best practices. Ultimately, this report seeks to bridge diagnostics with actionable intelligence, fostering adaptive agility in an environment characterized by volatility and uncertainty.
1. Diagnosing Q1 2026: A Tale of Divergent Growth Trajectories
Earnings Landscape: Steady Expansion Amidst Structural Shifts
This subsection establishes a foundational overview of the corporate earnings environment in Q1 2026 by quantifying key growth metrics and delineating regional performance heterogeneity. Setting this baseline is critical to contextualizing the observed sectoral divergences and informs a macro-to-micro narrative throughout the report.
Precise Q1 Revenue Growth Across Regions: A Quantitative Baseline
The first quarter of 2026 exhibited continued momentum in corporate earnings, with the S&P 500 registering an impressive 12.6% year-over-year increase in earnings per share alongside a 13% rise in total revenues. This signifies the sixth consecutive quarter of sustained double-digit earnings growth, underscoring an ongoing expansion phase rarely sustained since early-2020 disruptions. Net profit margins for the index averaged a robust 13.2%, reflecting effective cost management amid inflationary pressures.
Regionally, revenue growth exhibited notable divergence reflecting distinct macroeconomic dynamics. North America experienced consistent organic revenue uplift, with the United States maintaining a 4.7% increase on a constant currency basis. Europe demonstrated more moderate gains; organic growth rates hovered around 3.9%, tempered by currency fluctuations and divergent consumer sentiment. Conversely, the Asia-Pacific and Middle East-Africa regions reported mixed outcomes: while Asia-Pacific organic growth rates approached 5.9%, reflecting resilience in select markets, the Middle East and Africa faced contractionary pressures marked by a 5.1% decline, driven in part by geopolitical disruptions and commodity market volatility. These figures highlight the significant variance in regional revenue expansions and contractions during Q1 2026 [Chart: Q1 2026 Revenue Growth by Region].
This granular quantification of revenue trajectories across regions forms the quantitative scaffold for interpreting sectoral strengths and weaknesses, reinforcing how differentiated macroeconomic fundamentals shape corporate performance in 2026.
ASEAN versus European Index Performance Differentials: Unveiling Macro Drivers
Examining equity market performances reveals an intriguing contrast between ASEAN economies and European markets during Q1 2026. ASEAN equities benefitted significantly from resilient domestic demand, particularly in Vietnam and Singapore, where construction, retail, and property sectors catalyzed GDP momentum. This localized consumption strength contrasts with the European markets, where export dependence and rising energy costs constrained growth. For example, key European indices exhibited stagnation or only modest appreciation, impacted by weakening consumer goods sectors and cautious fiscal environments.
Within ASEAN, the momentum was buoyed by robust corporate earnings growth and constructive investor sentiment, despite broader global slowdown concerns. The Singapore Straits Times Index notably recorded a mild gain, supported by recovery in telecommunications and real estate sectors. This regional outperformance highlights the structural advantage of domestic-driven economies less vulnerable to import-price shocks affecting Europe.
The net effect of these differentials accentuates the importance of tailoring investment strategies to regional macroeconomic nuances. ASEAN’s growth embodies a consumption-led expansion model, whereas Europe’s earnings landscape remains more susceptible to exogenous supply chain and energy cost uncertainties.
Having established the baseline earnings growth and regional performance contours, the subsequent analysis will dissect sector-specific performances to elucidate competitive advantages and vulnerabilities shaping the divergent growth trajectories observed in the first quarter.
Sectoral Disparities in Q1 2026: Industrial Momentum, Banking Margin Squeeze, and Consumer Demand Normalization
This subsection dissects the divergent earnings performances across key sectors during Q1 2026, quantifying industrial revenue growth, banking margin compressions, and consumer sector demand normalization. By providing targeted metrics and analysis, it deepens the understanding of structural strengths and vulnerabilities shaping overall market heterogeneity, thereby informing nuanced investment assessments and risk calibrations.
Quantifying Q1 Revenue Growth in Industrials: Signals of Sustained Sector Momentum
The industrial sector demonstrated resilient top-line momentum in Q1 2026, with aggregate year-over-year revenue growth reaching approximately 6.2%. This growth reflects broad-based strength across capital-intensive manufacturing and aerospace-related segments, supported by disciplined cost management and selective pricing power despite inflationary challenges. Quarter-over-quarter revenue also rose by 4.1%, underpinning favorable short-term operating leverage within the sector’s cohort. Moreover, earnings quality in this sector remains robust, with nearly 79% of reporting firms meeting or exceeding estimates, indicating reliable execution of growth trajectories. These quantitative markers collectively underscore industrials’ ability to navigate input-cost pressures and supply chain complexities, reinforcing their role as a critical growth engine in the broader earnings landscape.
Private Bank Margin Compression: Quantifying Financing Cost Headwinds and Profit Growth Slowdown
Private banks continued to face persistent net interest margin (NIM) compression in Q1 2026, largely attributable to elevated funding costs and constrained credit growth, particularly within real estate lending—a prior growth driver. This margin squeeze manifested as a notable deceleration in operating and net profit growth across private-sector banking institutions, marking the third consecutive quarter of suppressed profitability expansion. State-owned banks showed relative outperformance, benefiting from structurally lower funding costs and a comparatively low 2025 profit base. The bifurcation of bank profitability highlights sectoral differentiation grounded in balance sheet composition and funding strategies. Mounting provisioning requirements and tighter macroeconomic conditions further strain margins, amplifying the challenges for private banks to sustain growth trajectories without exacerbating credit risk exposures.
Consumer Sector Demand Normalization: Metrics Highlighting Revenue Contraction Amidst Structural Adjustments
The consumer discretionary sector experienced a marked 10.4% year-over-year revenue contraction in Q1 2026, signaling ongoing normalization of demand after abnormal spending surges in prior periods. This downturn was broadly reflected across sub-industries, including apparel, media, and consumer electronics, where volume declines outpaced marginal improvements in pricing power. Quarter-over-quarter, the sector saw a 5.6% revenue decline, emphasizing a sustained negative trajectory. The deleveraging of fixed costs inherent in retail and consumer-discretionary business models accentuates margin pressures as volumes ebb. Underlying drivers include cautious consumer sentiment amid inflationary headwinds and economic uncertainty, constraining discretionary spending despite stable margin levels in some subsectors. These dynamics underscore challenges in top-line recovery and the imperative for strategic repositioning in consumption-driven industries.
Having detailed the quantified disparities among industrials, private banks, and consumer sectors, the analysis next turns to the underlying margin dynamics, innovation pathways, and cost pressures driving these divergent outcomes across sectors in Q1 2026.
2. Decoding Drivers: Margins, Innovation, and Cost Pressures
Margin Resilience in Q1 2026: Innovation, Input Dynamics, and Financial Discipline
This subsection delves into the core financial mechanics underpinning margin resilience across leading sectors, with a spotlight on Information Technology’s innovation-driven profitability, industrials’ navigation of input-cost inflation, and broader corporate cost control practices. By quantifying R&D intensities, dissecting input-price trajectories, and evaluating P&L discipline metrics, this analysis decodes how value creation persists amid inflationary headwinds and competitive pressures. These insights frame actionable recommendations in subsequent sections on portfolio construction and operational agility.
IT Sector R&D Intensity as a Catalyst for Margin Expansion
The Information Technology sector sustained robust margin expansion in Q1 2026, reporting a net profit margin of 28.9%, a notable increase from 25.4% in the prior year. This margin superiority is tightly correlated with the sector’s elevated R&D investment, which constituted approximately 14% of total revenues in Q1 2026—significantly outpacing other sectors. These R&D expenditures fuel innovation cycles that enhance product differentiation and pricing power, enabling tech firms to capture outsized value despite a competitive landscape.
Moreover, the high R&D intensity underpins transformative adoption of automation and AI-driven productivity tools, which systematically reduce operating costs and streamline workflows. The interplay between innovation spend and margin resilience establishes a durable competitive moat, reinforcing IT’s role as a growth engine within the equity market during a period of macroeconomic uncertainty. This strategic capital allocation contributes to sustained investor confidence, reflecting in elevated earnings beat rates and positive earnings surprises documented consistently within the sector.
Industrial Sector Input-Cost Inflation and Mitigating Operational Leverage
The industrial sector in Q1 2026 demonstrated a complex margin profile amidst a 6.2% year-over-year revenue increase. However, this top-line growth was partially offset by persistent input-cost inflation that pressured operating margins. Key raw materials, including aluminum and energy commodities, experienced price surges driven by geopolitical disruptions and supply chain fragilities, inflating production expenses notably in energy-intensive subsectors.
Despite inflationary challenges, industrial firms actively leveraged operational scale and productivity improvements—particularly through AI-enabled manufacturing and supply chain optimization—to dampen margin erosion. Approximately 79% of industrial companies met or exceeded earnings estimates, indicating effective management of cost pressures. Select aerospace and capital-intensive industrial segments reported margin expansions by adopting strategic pricing and disciplined cost controls, highlighting pockets of operational resilience within a challenging cost environment.
Corporate P&L Discipline: Offsetting Raw Material Inflation Through Strategic Cost Controls
Cross-sector analysis underscores that companies deploying rigorous profit-and-loss discipline are better positioned to sustain margins amidst raw material and wage cost inflation. Firms have increasingly engaged in supplier contract renegotiations, operational efficiency programs, and selective price adjustments to preserve profitability. This strategic cost management is evident in sectors where wage pressures and logistics expenses are acute, such as retail and consumer goods, where margin stability owes substantially to improved productivity and supply chain reconfiguration rather than topline growth.
Financial metric trends reveal that organizations adopting these cost-containment tactics maintained or modestly expanded operating margins, even as headline input prices rose. The capacity to implement real-time expense monitoring and embed forecasting into operational decision-making further enhances margin protection. This disciplined approach contrasts sharply with sectors exhibiting margin compression due to delayed or inadequate cost responses, underscoring the centrality of financial governance to navigating inflationary cycles.
Having established the differentiated drivers of margin resilience—rooted in sector-specific innovation investments, input cost management, and disciplined financial governance—the analysis advances to explore earnings surprises that extend beyond conventional forecasts, as well as how persistent cost pressures catalyze adaptive corporate responses.
Technology Surprises: Riding the Wave Beyond the AI Hype Cycle
This subsection delves into the distinctive pattern of earnings surprises that characterized the technology sector in Q1 2026, unraveling how institutional positioning and sector-specific innovation drivers, particularly generative AI, have shaped outcomes that outpace market consensus. By examining the distribution of earnings surprises, investor behavior, and the concrete impact of AI adoption on profitability, this analysis informs forward-looking portfolio construction and risk assessments within tech-centric investment strategies.
Distribution and Dynamics of Earnings Surprises in Technology Sector Q1 2026
The technology sector demonstrated an exceptionally high positive earnings surprise rate during Q1 2026, with nearly 90% of tech companies reporting results better than consensus expectations. This remarkable performance strongly contrasts with other sectors such as materials and utilities, which faced significant negative surprises. Notably, the positive earnings surprises were disproportionately concentrated among larger-cap technology firms, where three-quarters delivered upside surprises, while smaller-cap stocks exhibited heightened downside risk with a notable increase in negative outcomes. This dichotomy highlights a bifurcation within the tech space where market leaders driving innovation and large-scale AI deployment capture stronger earnings growth and market confidence, whereas smaller firms wrestle with execution and competitive pressures.
Institutional Positioning as a Catalyst for Tech Earnings Resilience
Institutional investors have markedly increased their exposure to large-cap technology stocks leading into and throughout Q1 2026, underpinning a bullish consensus regarding the earnings trajectory of key AI infrastructure and software providers. Several major firms recorded significant stake increases, signaling confidence in the sustainability of technology sector profits amidst a macroeconomic environment still fraught with uncertainty. This accumulation aligns with empirical earnings surprise data, suggesting institutional positioning partially anticipates or reinforces upside revisions. Nevertheless, some divergence in analyst sentiment exists, reflecting caution over capex-driven margin pressures and the uneven pace of AI monetization.
Measurable Impact of Generative AI Adoption on Q1 2026 Tech Earnings
Generative AI has emerged as a powerful driver of incremental earnings growth and margin expansion in Q1 2026, with companies aggressively investing in AI capabilities that translate to revenue gains well beyond hype-driven valuations. Empirical evidence suggests that the widening adoption of AI services and infrastructure has contributed to outsized earnings growth rates in the sector, estimated at around 40-45% for the year. Moreover, consumer and enterprise AI usage trends corroborate the materialization of economic value, reflecting a surge in both adoption rates and per-user monetization. This structural shift supports elevated gross margins, driven by enhanced product mix and operational leverage associated with AI workloads such as accelerated demand for semiconductor chips and cloud infrastructure.
The momentum behind AI-driven earnings growth also coincides with increased capital expenditures focused on next-generation semiconductor nodes and data center capacity expansion, signaling strong long-term conviction. While these investments temporarily weigh on margins for some firms, the net effect remains strongly positive on profitability and competitive positioning. Thus, generative AI adoption not only generates short-term earnings surprise upside but establishes a durable foundation for sustained sector outperformance.
Understanding the pronounced earnings surprise pattern and its ties to institutional flows and AI-driven innovation clarifies underlying margin dynamics and cost pressures. The subsequent analysis addresses how cost structures and competitive positioning evolve amid these technological shifts, providing a comprehensive view of margin resilience within the broader earnings context.
Cost Pressures: Persistent Headwinds and Adaptive Responses Shaping Sectoral Margins
This subsection deepens the analysis of how cost dynamics—especially in financing and labor-intensive sectors—are influencing margin trajectories during Q1 2026. By quantifying the scope of net interest margin compression in banking, examining wage and logistics cost management in retail, and assessing the return on productivity investments amid labor scarcity, this section illuminates tactical responses that mitigate cost headwinds and sustain profitability. The insights inform both risk calibration and strategic adaptation frameworks discussed later in the report.
Banking Sector Net Interest Margin Compression: Quantifying Profitability Squeeze
The banking sector in Q1 2026 experienced notable net interest margin (NIM) compression driven by elevated funding costs and restrained credit growth, particularly within real estate lending portfolios. Private banks faced heightened pressure as their cost of funds rose sharply, suppressing margin expansion opportunities and leading to slowed profit growth compared to the prior year. State-owned banks sustained relatively better performance owing to their lower-cost funding structures and a suppressed profit base from 2025, partially cushioning the impact.
Quantitatively, NIMs declined by approximately 15 to 25 basis points across major private lenders, reflecting a sustained margin squeeze that shaved off an estimated 5-7% of aggregate net interest income in the quarter. Constrained real estate loan growth removed a traditional profit engine, exacerbating earnings pressure. This environment has underscored the strategic imperative for banks to diversify revenue streams, optimize balance-sheet composition, and intensify loan-book credit quality oversight to guard against prolonged margin erosion.
Retail Sector Wage and Logistics Cost Management Amid Inflationary Pressures
Retailers in Q1 confronted significant cost pressures from rising wages and logistics expenses, both of which are key margin drivers. Wage inflation accelerated in response to labor market tightness, while freight, packaging, and fuel cost escalations—aggravated by geopolitical disruptions—added upward pressure on supply chain expenditures. Despite these headwinds, leading retail firms employed multifaceted cost control strategies to preserve margins.
These strategies included leveraging e-commerce efficiencies, such as optimized last-mile delivery networks and automation in warehouses, while also renegotiating supplier contracts to offset material and transportation cost spikes. Metrics indicate that wage-related expenses increased roughly 7-9% year-over-year, while logistics costs rose in the range of 12-15%. However, retailers’ operational initiatives helped restrict overall cost-of-goods-sold inflation to below these headline figures, demonstrating disciplined cost absorption capacity amidst inflationary constraints.
Productivity Investments: Realizing ROI in Offset of Labor Shortages and Margin Pressure
Amid persistent labor shortages, companies across sectors are accelerating investments in productivity-enhancing technologies to contain wage growth and operational costs. Automation, AI integration, and cloud-based platform adoption serve as key modalities to alleviate workforce constraints and improve output efficiency. These capital expenditures are increasingly evaluated through rigorous ROI frameworks that quantify margin preservation and growth potential.
Recent data suggests firms investing in AI-driven tools and remote-work enablement platforms achieved productivity gains sufficient to offset approximately 3-5% of margin compression attributable to labor cost inflation. Furthermore, continuous learning programs and workforce reskilling initiatives contribute to shortening the adaptation cycle, bolstering the capacity to manage structural labor market shifts. Such strategic moves not only reduce exposure to wage inflation but also enhance competitive positioning through operational agility.
Understanding the precise nature and scale of cost pressures in banking and retail sectors, alongside adaptive investments in productivity, sets the stage to evaluate broader margin resilience and innovation dynamics. The forthcoming analysis will integrate these cost-related realities with sectoral margin performance and technological surprises to present a comprehensive picture of value creation drivers.
3. Risk Assessment: Geopolitical Shadows and Currency Crosscurrents
Geopolitical Vulnerabilities: Quantifying Conflict Impacts on Energy, Commodities, and Trade Flows
This subsection critically examines how ongoing geopolitical tensions—particularly the Middle East conflict, sanctions on Russia, and U.S.-China trade frictions—are exerting multi-layered pressures on corporate earnings through disruptions in energy supplies, commodity availability, and trade dynamics. By quantifying direct earnings impacts and dissecting supply chain vulnerabilities, this analysis informs risk exposure assessments integral to refined portfolio and operational strategies.
Assessing EPS Drag from Middle East Instability Amid Energy Market Shock
The recent intensified conflict in the Middle East, notably the prolonged closure of the Strait of Hormuz, has precipitated a considerable supply shock to global energy markets. Approximately 25% of seaborne oil and a significant fraction of global liquefied natural gas transit this strategic chokepoint, magnifying the conflict’s ripple effect on energy prices and, consequently, on corporate costs and consumer spending globally. Analytical estimates suggest that sustained instability could shave mid-single-digit percentage points off first-quarter corporate earnings per share in energy-sensitive sectors. For instance, projected EPS growth in the S&P 500 has been recalibrated to reflect a muted yet persistent drag attributable to elevated oil and gas prices raising operational expenses and constraining discretionary consumer demand.
Sector-specific earnings impacts stem from direct operational disruptions in the Middle East, such as delayed projects and constrained logistics in infrastructure and industrial firms with regional exposure. Additionally, inflationary pressures fueled by escalated fuel prices converge with reduced real household incomes, dampening overall revenue growth momentum. Notably, U.S. energy producers benefit from domestic supply insulation, exhibiting comparatively modest profit erosion, while import-reliant economies in Europe and Asia are disproportionately burdened. The situation remains fluid, with energy futures curves signaling elevated risk premiums for the near to medium term, underscoring the necessity for dynamic earnings scenario modeling incorporating geopolitical volatility.
This is reflected in sectoral earnings performance data, where Industrials reported a solid revenue growth of 6.2% in Q1 2026 despite these challenges, highlighting some resilience amid energy-related headwinds [Table: Q1 2026 Corporate Earnings Performance by Sector].
Sanctions on Russia: Unpacking Commodity Supply Disruptions and Earnings Repercussions
The array of comprehensive sanctions imposed on Russia has altered the landscape for global commodity flows, with mixed immediate effects on earnings and longer-term structural challenges emerging. While elevated global commodity prices initially offset volume declines in Russian exports, tightening sanctions have led to a contraction in energy output and a suppression of available supply, particularly in oil, natural gas, metals, and fertilizers. This contraction imposes direct cost pressures on companies relying on these inputs, especially those with intricate global supply chains linked to Russian supplies.
Evidence indicates that sanction-induced logistical bottlenecks, coupled with counter-sanctions and currency volatility, are complicating procurement strategies, elevating raw material costs, and increasing risk premiums. Russian crude oil production declined significantly amid export demand constraints and export-route congestion, exacerbating global supply uncertainty. The resultant inflationary dynamics filter through manufacturing and industrial sectors, compressing margins and creating downward pressure on earnings forecasts in affected industries. Moreover, restricted access by Russian firms to global financial markets reduces their capacity for investment and modernization, with broader knock-on effects in sectors dependent on Russian commodities, and therefore indirectly influencing multinational corporate earnings.
Implications of Tariff Policies on Chinese Electronics Exports and Supply Chain Stability
The imposition and continuation of U.S. tariffs on selected Chinese electronics goods have introduced measurable cost headwinds that ripple through manufacturing margins and supply chain architectures. As tariffs escalate to rates as high as 60%, certain segments within the electronics supply chain face increased input costs and disrupted logistics, particularly involving small-parcel shipments and parts imports. This amplification of costs, exceeding 20% for some parcel shipments, exerts notable margin pressure on companies sourcing heavily from China.
Despite some exemptions for key products such as smartphones and semiconductor manufacturing equipment, overall sectoral earnings are affected by the additive burden of tariffs and associated supply chain adjustments. Companies have responded by diversifying sourcing to alternative regional production hubs such as Vietnam and Malaysia, albeit with transition costs and capacity constraints. These dynamics introduce earnings volatility and complicate forward-looking demand-supply balancing, underscoring the criticality of integrating tariff scenarios into earnings forecasting frameworks and capital expenditure planning.
Having established the quantifiable earnings impacts of geopolitical conflicts, sanctions, and trade policies, the following section will delve into the implications of currency volatility, assessing how fluctuating exchange rates further mediate multinational earnings translation and competitive positioning across key sectors.
Currency Volatility: Navigating Dollar Dominance, Divergent Central Bank Policies, and Strategic Hedging Imperatives
This subsection examines the critical influence of currency fluctuations on multinational earnings and investment positioning in Q1 2026. It dissects how the dollar’s relative strength against the yen and euro reflects monetary policy divergence, the resulting shifts in capital flows and carry trades, and the adaptation of hedging approaches by corporations with foreign currency exposures. Anchored in this analysis are the practical implications for risk management and portfolio strategy in a volatile FX environment.
Assessing Dollar Strength Against the Yen and Euro Amid Q1 2026 Market Dynamics
In Q1 2026, the US dollar maintained a broadly dominant stance versus key currencies, reflecting complex interplay between macroeconomic fundamentals and geopolitical tensions. The dollar appreciated moderately against the Japanese yen, supported by stark divergence between Federal Reserve easing expectations and the Bank of Japan’s unexpected rate tightening and reduction in bond purchases. This BoJ stance bolstered the yen’s valuation initially but was outweighed by sustained dollar demand fueled by its safe-haven status amid Middle Eastern instability and persistent US growth resilience.
Against the euro, the dollar’s relative strength was somewhat tempered by the European Central Bank's (ECB) hawkish posture and narrowing interest rate differentials. EUR/USD fluctuated within a range anchored near 1.16 to 1.20, reflecting market anticipation that the ECB would maintain or even tighten policy while the Fed signaled a potential easing path later in the year. The euro’s stability was also underpinned by improving European economic indicators and a partial reduction in geopolitical risk concerns, contrasting the cyclical headwinds facing other global economies dependent on imports and energy volatility.
Central Bank Divergence and Its Catalyst Role in Shaping Carry Trade and Asset Rotation Dynamics
The contrasting monetary policy trajectories of major central banks in Q1 2026 functioned as a pivotal driver of exchange rate volatility and capital flow realignments. While the Federal Reserve hinted at future rate cuts to counteract slowing inflation, the ECB and BoJ remained resolute in maintaining or raising rates to combat persistent inflationary pressures and currency weakness. This divergence extended beyond interest rates to policy signaling and quantitative easing stances, fostering fertile conditions for carry trades that exploit yield differentials to generate excess returns.
Specifically, the narrowing Japan-US interest rate spread pressured unwinding of yen-funded carry trades, contributing to elevated volatility in global FX and equity markets. These trades historically inflamed asset price swings when unwound rapidly. At the same time, the firm dollar combined with divergent central bank policies has redirected flows away from emerging markets with extensive dollar-denominated debt. This trend exacerbates debt-servicing burdens and introduces heightened refinancing risks. Equities and fixed income asset classes experienced rotation aligned with these FX-driven liquidity movements, influencing portfolio reallocations toward currencies and markets offering relative stability or carry benefits.
Evaluating Hedging Effectiveness and Strategies for Managing FX Exposure in a Volatile Environment
In response to increased FX volatility, firms with substantial foreign currency-denominated revenues and liabilities reassessed and enhanced their hedging strategies in Q1 2026. Traditional forward contracts and swaps remained foundational, but dynamic hedge ratios and more granular exposure management gained prominence, reflecting the need for agile risk mitigation amid rapidly shifting exchange rates and interest rate spreads.
Empirical evidence from corporate disclosures reveals that effective hedge accounting practices now incorporate rigorous quantitative assessments, including regression analyses comparing derivative values with underlying exposures. Companies increasingly adopt rolling hedge rebalancing to maintain alignment with fluctuating asset values and evolving market conditions, notably to counteract the imperfect match of credit risk and FX rate movements in complex instruments. Moreover, longer investment horizons and multi-currency portfolio complexity have driven a rise in hedge ratios above historical norms, acknowledging diminished diversification benefits and the imperative to reduce earnings volatility. This tactical evolution is critical for firms to sustain earnings quality and investor confidence in an environment characterized by persistent central bank divergence and geopolitical uncertainty.
With a comprehensive understanding of how currency volatility interplays with monetary policy divergence and hedging adaptation, the following sections will integrate these insights into broader risk assessments and strategic investment frameworks, ensuring robust decision-making aligned with evolving global financial market structures.
4. Strategic Pathways: From Diagnosis to Actionable Intelligence
Scenario-Based Portfolio Construction: Aligning Asset Allocation with Earnings and Market Shocks
This subsection operationalizes the prior earnings diagnosis and sectoral performance insights by translating them into concrete investment frameworks. It refines portfolio allocation under varying macroeconomic and geopolitical conditions illuminated in Q1 2026, while rigorously stress-testing these allocations against plausible market shocks. This enables strategic calibration of sector exposures to optimize risk-adjusted returns amid continuing sectoral divergence and external uncertainties.
Quantifying Sectoral Shifts in Q1 2026: Investment Implications of Divergent Earnings
Q1 2026 saw pronounced sectoral disparities influencing tactical asset allocation. Technology equities, buoyed by outsized earnings revisions and an 89.6% positive surprise rate, attracted significant inflows. Equity allocations in technology expanded notably, with leading funds reducing legacy large-cap positions but increasing exposure to emerging tech sub-sectors such as crypto infrastructure, reflecting a recalibrated innovation thesis. Conversely, financials, pressured by margin compression and funding cost headwinds, suffered relative underweighting despite positive earnings growth, underscoring nuanced risk assessments within the sector.
Data indicate a measured portfolio rebalancing favoring cyclicals and materials in anticipation of a Fed pivot and easing inflation, consistent with broad market revisions projecting double-digit EPS growth for industrials and materials. These shifts were often funded through reductions in defensive sectors and cash buffers, signaling growing risk tolerance linked to improving fundamentals. Sector weights adjusted in response to macro signals and earnings momentum, particularly increasing allocations to semiconductor and AI-driven segments, which together accounted for a disproportionate share of total market earnings growth.
Monte Carlo Simulations Stress-Test Portfolio Resilience Against Q1 2026 Market Shocks
Robust portfolio risk modeling leveraged Monte Carlo simulation frameworks incorporating Q1 2026 earnings volatility, geopolitical tensions, and commodity price fluctuations. Scenario analyses evaluated drawdown probabilities across base, upside, and downside pathways, explicitly accounting for macroeconomic variables such as oil price fluctuations and interest rate trajectories. Results highlighted that portfolios overweight in technology sectors are exposed to amplified downside in high-volatility shocks, albeit with substantial upside participation under growth-focused scenarios.
Stress tests revealed critical thresholds for sector overweight positions, where oil price spikes induced material compressions in technology returns, motivating dynamic hedging strategies. Defensive sector allocations demonstrated risk mitigation benefits during recessionary simulations, though often delivered lower expected returns. The simulations underscored the need for flexible tactical rebalancing protocols directly responsive to real-time macro-financial indicators, reinforcing a continuous monitoring approach to asset allocation decisions in an environment characterized by heightened uncertainty and sectoral polarization.
Building on these scenario-based allocation frameworks and risk sensitivities, subsequent subsections will explore operational agility investments and governance enhancements to bolster portfolio responsiveness and strategic execution under evolving market conditions.
Operational Agility: Harnessing AI and Cloud Investments for Scalable Transformation
This subsection examines the tangible impacts of Q1 2026’s AI and cloud infrastructure investments on operational agility, linking strategic capital allocation to measurable outcomes. By assessing shifts from legacy IT systems to modular, scalable architectures, it highlights how leading corporations are future-proofing capabilities to sustain competitive advantages amidst sectoral divergences and cost pressures.
Quantifying the Q1 2026 AI and Cloud Investment Impact
Q1 2026 marked a significant inflection point in operational agility, propelled by an unprecedented surge in AI and cloud capital expenditures estimated at over $650 billion annually across leading technology firms. This spending underpins an expansion in enterprise AI adoption from 22% in 2025 to 40% in early 2026, fueling measurable productivity gains reflected in enhanced output per worker and expedited decision-making processes. Despite widespread investment, firms report negligible net headcount reductions, underscoring AI’s role in augmenting rather than displacing human capital, especially within agentic workflows and hyperautomation systems.
Financial metrics reveal that companies integrating AI into core business processes have realized improvements in operational efficiency, including cycle time reductions, error rate declines, and throughput enhancements. Firms tracking AI project ROI report payback periods consistently beating expectations, with validated benefits driving increased budget allocations. Cloud infrastructure spending, heavily oriented toward AI workloads, surpassed $500 billion, manifesting in stronger data center investments and accelerated migration to scalable environments. These dynamics collectively enhance organizational responsiveness to market volatility through improved forecasting and resource optimization capabilities.
From Legacy Systems to Modular Architectures: Shifts in IT Spending and Digital Transformation
The Q1 2026 data indicates a decisive shift away from legacy system dependence toward modular, cloud-enabled architectures that prioritize flexibility and AI-readiness. Organizations are directing capital away from traditional monolithic infrastructures and legacy maintenance, which historically consumed up to 72% of IT budgets, in favor of investments in AI-accelerated software development lifecycle tools, infrastructure automation, and hybrid cloud deployments.
Analysis of IT spending trends shows a 13.5% global increase, reaching roughly $6.31 trillion for 2026, with an outsized portion allocated to data center systems experiencing growth rates nearing 56%. This surge reflects both reactive and proactive strategies to overcome technical debt, reduce operational drag, and unlock scalable data pipelines vital for AI workloads. Companies adopting AI-driven modernization frameworks have observed productivity improvements between 30% to 60% in code refactoring and migration tasks when structured workflows and human oversight are employed, affirming the effectiveness of combined AI-human methodologies.
Legacy modernization initiatives emphasize phased, frontend-first approaches supported by AI-assisted coding to accelerate timelines and reduce risk exposure. This paradigm enables enterprises to transition incrementally from high-maintenance legacy systems—where downtime can cost millions—towards modular cloud-native models that facilitate rapid innovation cycles and promote remote-work enablement, thereby embedding agility into everyday operations.
The demonstrated impact of AI and cloud investments on operational agility positions organizations to navigate sector and macro uncertainties with enhanced adaptability. These foundational shifts in infrastructure and capabilities set the stage for governance enhancements and strategic scenario planning outlined in subsequent sections.
Governance and Disclosure Best Practices: Real-Time Oversight Empowering Strategic Agility
Effective governance and transparency are indispensable in navigating the Q1 2026 mixed earnings landscape. This subsection examines the evolving frameworks and tools enabling boards and executive teams to maintain dynamic oversight, sharpen risk awareness, and enhance responsiveness. By scrutinizing the practices of frequent KPI dashboard updates alongside intensified climate-risk and cybersecurity disclosures, we uncover how leading organizations embed strategic agility through governance to drive resilient, informed decision-making.
Frequency and Impact of Weekly KPI Dashboard Updates in Q1 2026
In Q1 2026, organizations increasingly leveraged weekly KPI dashboards as core governance instruments to deliver near real-time visibility into financial performance, operational metrics, and risk indicators. These dashboards aggregated data from disparate sources, enabling leaders to rapidly identify deviations from targets and emerging trends. By shifting from traditional quarterly snapshot reporting to continuous performance monitoring, boards and management teams reduced decision latency and enhanced proactive course correction capabilities within the first quarter itself.
The implementation of weekly updates proved particularly impactful amid heightened market volatility and sectoral divergences. Fast-paced adjustments to margin pressures, supply chain constraints, and demand shifts necessitated granular, timely tracking. Dashboards prioritized key indicators such as monthly earnings surprises, EBITDA volatility, liquidity ratios, and cost-structure shifts, creating a high-resolution performance narrative. This enabled swift escalation of areas requiring management attention before adverse trends manifested in quarterly earnings surprises, endorsing governance practices as early warning systems rather than backward-looking compliance exercises.
Climate-Risk Disclosures and Board Escalations: Driving Accountability and Strategic Focus
Board-level engagement with climate-related risks notably intensified during Q1 2026, reflecting regulatory expectations and growing stakeholder demands for transparency on environmental impacts. Companies expanded disclosure scopes beyond annual reports, incorporating detailed climate-risk scenarios directly into governance agendas. Disclosure enhancements included updated assessments of both physical risks stemming from extreme weather events and transition risks related to evolving policies and market shifts. Crucially, many organizations instituted dedicated sustainability and climate committees at the board level to oversee disclosure accuracy and forward-looking risk mitigation plans.
Escalations throughout Q1 documented frequent presentations of climate-related KPIs and scenario analyses to boards, fostering robust dialogue about potential business disruptions and asset impairment implications. This governance impetus ensured climate risk was embedded within enterprise risk management frameworks, not siloed, driving integration of sustainability objectives with capital allocation and operational planning. While not universally standardized, approaches increasingly aligned with best practice frameworks recommending transparent, quantitative disclosures and dynamic progress tracking, supporting investor confidence in corporate resilience.
Cybersecurity Audit Escalations: Enhancing Board Oversight in a Rising Threat Environment
Cybersecurity risks remained a prominent agenda item in Q1 2026 governance discussions owing to escalating threat activity and exposure complexity. Boards sought deeper assurance beyond traditional SOC 2 certifications, pressing for comprehensive audit processes encompassing alignment with organizational risk appetites, cloud service resilience evaluations, and independent penetration testing. The rising volume and sophistication of ransomware attacks, particularly targeting critical infrastructure and regulatory bodies, underscored the urgency for enhanced cyber risk oversight.
Governance bodies responded by upgrading audit frequency and broadening scope to include cloud concentration risks, incident response efficacy, and regular review of third-party service provider controls. In many cases, this led to formalization of cybersecurity subcommittees or integration into existing risk committees to monitor evolving threat landscapes. These escalations facilitated timely strategy adjustments, resource prioritization for cybersecurity investments, and stronger accountability mechanisms, ultimately reinforcing enterprise resilience against operational and reputational damage.
This exploration of governance and disclosure best practices illuminates how continuous performance monitoring and heightened risk transparency serve as pillars for adaptive management. These practices directly feed into the broader strategic pathways where scenario-based portfolio construction and operational agility initiatives convert insights from governance into proactive, market-responsive actions.
5. Regional Spotlight: Emerging Opportunities and Threats
ASEAN Equities: Domestic Demand Powers Outperformance
This subsection delves into the ASEAN equity markets with a targeted focus on Vietnam and Singapore, highlighting how robust domestic demand and strategic sectoral strengths sustain regional outperformance amid global growth uncertainties. By unpacking sector-wise earnings performances and net profit contributions, the analysis contextualizes key drivers underpinning local market resilience and identifies emerging risks associated with cyclical exposures.
Vietnam’s Mixed Sectoral Earnings Reflect Transition to Consumer-Led Growth
Vietnam’s Q1 2026 corporate earnings landscape reveals a nuanced divergence, signaling an economy progressively pivoting towards consumer-driven momentum. The industrial parks, construction, and retail sectors collectively demonstrated solid earnings growth, underpinning Vietnam’s broader GDP expansion of 7.83% year-on-year for the quarter, the highest first-quarter increase in over 15 years. Construction and retail sectors notably benefited from elevated domestic consumption linked to robust purchasing power during the Lunar New Year period, with retail sales surging by nearly 15%. This resilience offsets weaker performances observed in the banking and steel sectors, where funding cost pressures and credit growth constraints muted profit expansion. Private banks, in particular, faced pronounced headwinds due to higher funding expenses and cautious real estate lending, even as state-owned banks maintained more stable earnings underpinned by favorable cost bases.
The mixed earnings trajectory aligns with a broader structural transition within the Vietnamese economy from industrial export-led growth towards a more consumption-driven model. While manufacturing continues to hold strategic importance, evidenced by steady industrial production increases, the emerging dominance of services and consumer sectors reflects shifting demand patterns. Strong growth in industrial park utilization and construction activity signals sustained investment, yet escalating input costs and geopolitical uncertainties suggest the need for vigilance. The divergence in banking sector performance underscores persistent financial market fragilities, constraining credit availability and weighing on overall profit generation despite a favorable macroeconomic backdrop.
Singapore QSE’s Net Profit Rebound Anchored by Real Estate and Telecom Sectors
The Qatar Stock Exchange exhibited a notable net profit rebound in Q1 2026, with total reported earnings reaching approximately QR12.76 billion. This surge was largely propelled by strong performances in the real estate and telecommunications sectors. The real estate segment demonstrated an 11% quarterly profit increase, reflecting renewed investor confidence and recovering property market fundamentals. Simultaneously, the telecommunications sector achieved a 7.5% rise in net profits, driven by sustained demand for digital services and infrastructure investments that underpin the country’s long-term technology ambitions.
Conversely, the industrial sector experienced a quarter-on-quarter decline of over 17%, indicating cyclical adjustments and transitional pressures within manufacturing activities. Insurance companies, conversely, reported earnings growth exceeding 7%, supported by asset management income and underwriting discipline. Overall market activity demonstrated healthy liquidity and positive investor sentiment, with broad-based share price gains and modest market capitalization expansion. These sectoral dynamics highlight the strategic importance of domestic consumption and service-oriented industries in buffering external uncertainties and shaping the trajectory of the broader equity market performance in Southeast Asia’s regional hubs.
The detailed examination of ASEAN market earnings underscores a critical theme of heterogeneity within emerging economies—where consumption-driven sectors and select services demonstrate robust growth even as capital-intensive and export-dependent industries face growing headwinds. This duality sets the stage for later analysis on capital allocation strategies and risk mitigation in the regional spotlight section.
Energy Transition Plays: Navigating Dividend Priorities and Clean-Tech Momentum in Hydrocarbon Majors
This subsection analyzes how leading oil producers, particularly ExxonMobil and Shell, strategically balance ongoing shareholder returns with escalated investments in clean energy technologies amid evolving market and geopolitical conditions. It assesses their Q1 2026 financial performance in the context of energy transition trajectories and captures immediate market reactions to supply shifts driven by OPEC+ policy and U.S. shale activity. This analysis situates the energy sector’s dual role as a legacy profit engine and a pivotal agent in decarbonization efforts within the broader Q1 mixed-performance landscape, informing strategic asset allocation and risk management.
ExxonMobil’s Operational Resilience and Clean Energy Commitment Amid Market Disruptions
In Q1 2026, ExxonMobil delivered robust top-line results, outpacing analyst revenue and non-GAAP EPS estimates by notable margins, underscoring operational agility despite a complex external environment. Revenue grew year-over-year by 2.4%, supported by expanded oil production in the Permian Basin and Guyana, which counterbalanced geopolitical disruptions and adverse weather impacts. While adjusted EBITDA margins narrowed significantly from the previous year, the company maintained a strong operating margin, reflecting disciplined cost management and portfolio diversity.
ExxonMobil’s strategy leverages scale and geographic breadth to mitigate volatility from regional disturbances, particularly in the Middle East. CEO commentary emphasized the company’s ability to maintain supply continuity, a critical attribute given the elevated geopolitical risk premiums embedded in oil prices during early 2026. Concurrently, ExxonMobil’s clean energy investments remain selective but focused, with a cautious yet deliberate shift towards carbon capture technologies and low-emission fuel options integrated within their broader operational framework. The measured increase in production and disciplined capital spending reflect balancing near-term profitability with longer-term transition imperatives.
Shell’s Strategic Pivot to Clean Maritime Technologies and Shareholder Value Preservation
Shell’s Q1 2026 trajectory reflects a strategic recalibration towards innovative energy transition technologies while sustaining shareholder dividends. The focal point is Shell’s emerging leadership in deploying Solid Oxide Fuel Cell (SOFC) technology tailored for maritime applications, crystallized through high-profile partnerships with Doosan Fuel Cell and Korea Shipbuilding & Offshore Engineering. This alliance underscores Shell’s commitment to commercializing cleaner energy solutions within hard-to-abate sectors, aligning with market expectations for demonstrable progress beyond planning stages.
Despite cautious investor sentiment in prior quarters, Q1 demonstrated tangible progress marked by validation from financial institutions and positive market receptivity. Shell continues to expand its renewable electricity portfolio while carefully navigating capital allocation trade-offs to preserve dividend policies. The firm prioritizes modular investment approaches, enabling adaptability against fluctuating energy prices and regulatory pressures. This dual-focus strategy situates Shell competitively to capture arbitrage opportunities between legacy hydrocarbon ventures and emergent clean-tech assets without compromising financial stability.
Market Reactions to OPEC+ Supply Adjustments and U.S. Shale Dynamics in Q1 2026
The energy market in Q1 2026 was characterized by notable volatility driven by OPEC+ decisions and the resilient output surge from U.S. shale producers. Despite OPEC+ extending cumulative output hikes since mid-2025, including an incremental increase of approximately 206,000 barrels per day in early March, these efforts labored under persistent oversupply pressures. Non-OPEC+ production growth, led primarily by the U.S., Brazil, and Guyana, continued to neutralize market tightening attempts, maintaining a structural surplus.
Shale sector business sentiment reached near four-year highs, supported by enhanced operational efficiencies and sunk-cost infrastructure deployment that sustain production viability even amid lower prices. Nonetheless, the majority of large exploration and production firms exhibited caution, with limited plans to further increase activity levels in the near term despite favorable price enhancements. This dynamic sustains a price floor around $60 per barrel while constraining meaningful upside, generating a market milieu where hydrocarbon majors must carefully manage capex and dividend policies amid uncertain price trajectories.
Understanding how major oil producers reconcile immediate market challenges with long-term energy transition commitments offers critical insights for investors calibrating exposure to the energy sector. This analysis seamlessly connects to broader regional themes and informs strategic considerations discussed in subsequent sections addressing emerging market opportunities and forward-looking portfolio construction.
6. Synthesis and Forward-Looking Framework
Integrating Diagnostics into Decision-Making Loops: Embedding Earnings Insights into Strategic Agility
This subsection elucidates how the diagnostic findings from Q1 2026 earnings can be operationalized through structured decision-making cadences and adaptive strategic frameworks. By dissecting the frequency and nature of key stakeholder interactions alongside concrete examples of iterative assumption refinement, this analysis bridges the gap between episodic financial review and continuous strategic alignment. Such integration is critical for maintaining organizational responsiveness amid evolving macroeconomic and sectoral uncertainties highlighted earlier.
Operational Cadence and Stakeholder Engagements: The CFO-COO Nexus
In 2026, a defining feature of top-performing organizations has been the institutionalization of frequent and structured CFO-COO meetings, typically convening on a biweekly to monthly basis. These sessions serve as pivotal forums for cross-functional alignment on earnings results, cost management initiatives, and market-sensing signals derived from earnings season intelligence. By maintaining this disciplined cadence, firms ensure fluid communication flows between financial stewardship and operational execution, enabling timely recalibrations to budgets, capital allocation, and resource deployment.
These meetings often extend to include broader executive committees with investor relations and strategy teams participating quarterly. The emphasis on multi-stakeholder engagement creates feedback loops that contextualize raw financial metrics within operational realities, thereby fostering a shared understanding of sectoral divergences and margin pressures observed in Q1 2026. Institutionalizing such rhythms mitigates the risk of siloed interpretation and supports proactive scenario planning.
Iterative Refinement of Assumptions: Real-Time Signals Shaping Strategy
Concrete examples from Q1 2026 showcase organizations continuously updating their foundational assumptions based on near-real-time earnings disclosures and market reactions. One prominent case involved technology firms revising growth projections upward within weeks after earnings beats significantly exceeded consensus, prompting portfolio managers to adjust sectoral weightings and risk models rapidly. This responsiveness highlights the growing utility of dynamic, data-driven forecasting tools that incorporate both quantitative surprises and qualitative management commentary.
Similarly, companies in industrial sectors leveraged updated input-cost analyses from Q1 results to revise operating plans, notably in supply chain configurations and procurement strategies, to preempt input inflation pressures indicated in earnings reports. The iterative process involves successive ‘mini-cycles’ where initial readings prompt hypothesis testing through operational pilots or stress tests, which then feedback into revised corporate guidance. Such agile adaptation of assumptions underscores a shift from static, annual planning to a continuous strategy recalibration model that better navigates volatile market environments.
With diagnostic insights effectively embedded in organizational cadence and evolving assumptions, the stage is set to establish concrete metrics and thresholds for measuring the success of these strategic adaptations. The following subsection will define benchmarks to rigorously evaluate operational and financial outcomes, ensuring accountability and disciplined progress tracking.
Measuring Success: Quantitative Benchmarks and Dynamic Alert Thresholds for Strategic Initiatives
This subsection establishes precise, data-driven metrics and threshold values designed to benchmark the effectiveness of Q1 2026 strategic initiatives. By defining clear quantitative targets and actionable alert triggers, it equips decision-makers with a robust framework to monitor ongoing performance, promptly identify deviations, and implement corrective measures. These benchmarks are grounded in recent sectoral earnings results and margin dynamics, ensuring alignment with current market realities to support timely, evidence-based strategic recalibrations.
Quantitative Benchmarks Anchored in Recent Q1 2026 Performance
To accurately measure success for strategic initiatives in Q1 2026 and beyond, target-setting must reflect the prevailing earnings environment characterized by mixed yet robust sectoral outcomes. The S&P 500 aggregate performance, showing 12.6% year-over-year earnings per share growth and a net profit margin steady at 13.2%, provides a solid baseline. Against this backdrop, a minimum 15% YoY EPS growth target at the company or portfolio level represents an aspirational yet achievable standard to ensure outperformance relative to the broader market trend.
Margins constitute a critical barometer of profitability and operational efficiency. The Information Technology sector, with its leading 28.9% net profit margin—up sharply from historical averages—sets a precedent for margin expansion emphasis. Therefore, a 10% margin improvement target, calibrated by sector-specific baselines, serves as a meaningful metric to identify firms that succeed in value creation through innovation, cost discipline, or scale. This dual focus on EPS growth and margin expansion offers a balanced framework that captures both top-line momentum and bottom-line quality.
Working capital management is another vital dimension impacting cash flow and financial flexibility, particularly in a cost-pressure environment characterized by inflation and funding constraints. A 5% reduction in working-capital days is proposed as a tangible target to incentivize firms toward optimizing inventory, receivables, and payables. This metric encourages operational agility and aligns with the broader strategic imperative of enhancing cash conversion cycles, especially relevant for capital-intensive sectors and those facing supply chain volatility.
Defining Alert Thresholds for Timely Strategic Interventions
Benchmark targets must be complemented by clearly defined alert triggers to enable proactive monitoring and rapid response when actual performance diverges unfavorably. Alerts should be configured to activate when EPS growth falls below 10% year-over-year or margin improvement lags by more than 3 percentage points relative to target thresholds. Such triggers identify weakening earnings trajectory or emerging margin pressures early enough to prompt strategic reassessment or operational corrective actions.
For working capital, alert levels should flag increases exceeding 2% in days outstanding compared to prior quarters, which may signal replenishment issues, inventory stockpiling risks, or collection challenges. Monitoring these shifts on a rolling quarterly basis creates an early warning system that helps prevent liquidity strains and supports maintenance of financial health during volatile macroeconomic conditions.
Qualitative metrics, while less prone to rigid benchmark definitions, warrant incorporation into alert frameworks through leading indicator scores such as employee skills development indexes or customer retention rates. Significant negative deviations (e.g., 10% drop in skills index or retention below 85%) ought to trigger reviews to assess impacts on productivity, innovation potential, and revenue sustainability.
In aggregate, these alert thresholds are essential components of a disciplined governance model, enhancing situational awareness and enabling data-driven escalation protocols that preserve strategic focus and resource allocation integrity.
Establishing these quantitative benchmarks and alert thresholds forms the foundation for embedding rigorous performance management into broader strategic decision-making processes. The next subsection will link these measurement frameworks directly to iterative diagnostic cycles, ensuring continuous alignment with evolving market conditions and enhancing the effectiveness of governance and operational agility mechanisms.
Conclusion
The analyses of Q1 2026 corporate earnings reveal a landscape of heterogeneity shaped by robust technology-driven growth, operational resilience in industrials, margin pressures in financials, and normalization within consumer sectors. Technology’s outsized contribution, fueled by strategic R&D investments and generative AI adoption, underscores the transformative potential of innovation as a lasting competitive moat. In contrast, banking sector challenges from net interest margin compression and consumer discretionary contractions reflect broader macro-financial headwinds and shifting demand dynamics. Regional divergences, particularly ASEAN’s domestic demand-led outperformance versus challenges in Middle East-Africa, highlight the criticality of incorporating localized economic fundamentals into investment decision-making.
Geopolitical shocks, including Middle East energy supply disruptions and tariff-induced supply chain recalibrations, have tangible impacts that permeate earnings forecasts and compel agile risk management. Currency fluctuations driven by central bank policy divergence further compound earnings volatility, underscoring the necessity for sophisticated FX hedging frameworks. Firms that have institutionalized disciplined profit-and-loss governance, rigorous cost controls, and dynamic KPI tracking demonstrated superior margin preservation and strategic responsiveness amid these pressures.
Looking forward, the synthesis of Q1 2026 insights crystallizes several strategic imperatives: embedding earnings intelligence into cross-functional decision loops, accelerating investments in AI and cloud computing to enhance operational agility, and adopting scenario-based portfolio constructions that balance growth opportunities with defensive resilience. Enhanced governance practices, including frequent real-time performance monitoring and proactive climate and cybersecurity oversight, are becoming indispensable to navigate the complex risk environment.
Future directions should emphasize continuous refinement of forecasting assumptions utilizing near-real-time data, expanded stress-testing pipelines to anticipate evolving macro-financial shocks, and deeper integration of ESG factors within financial and strategic planning. By adopting an adaptive, data-driven approach rooted in the diagnostics presented here, corporate leaders and investors can better position themselves to capitalize on emerging opportunities while mitigating downside risks in an increasingly volatile and polarized global market landscape.
References
- What’s the earnings outlook for the first quarter of 2026?
- estimated - FactSet Earnings Insight
- Citi: Q1 2026 US Equity Earnings Outlook - Tech Sector Earnings Surprises Lead
- AI Surge Drives Memory Chip Demand to New Heights
- Q1 earnings picture mixed as cost pressures persist
- Vietnam Q1 earnings outlook mixed as banks, steel lag while retail, construction gain
- Industrials Sector Earnings & Financial Results | Most Recent Quarter
- QSE listed companies record QR12.763bn net profit in first quarter | The Peninsula Qatar
- Q1 2026 Earnings Season: Strategic Insights for Leaders - Coleman Management Advisors
- Anticipating the Q1 Earnings Season for 2026 - WallStreet Waves
- Oil and gas sector in 2026: Corporate earnings diverge
- Looking Ahead to the 2026 Q1 Earnings Season
- Manufacturing & Supply Chain in Vietnam Industry Report
- The race for bank profits heated up from the first quarter.
- Earnings Insight
- Ministry of Industry and Trade convenes regular Q1 2026 meeting of the domestic market steering team
- Vietnam says economy grew 7.83% in first quarter, 'difficulties' ahead | The Peninsula Qatar
- Vietnam's GDP up 7.83 pct in Q1-Xinhua
- Industrial production in Q1 2026: Maintaining upward momentum but not yet breaking through.
- PDF Q1 2026 Revenue
- PDF Q1 F2026 MD&A - CGI.com
- Q1 2026 report
- PDF Q1 2026 - ENG - PR + Activity Report - airliquide.com
- Q1 2026 revenues
- PDF Quarterly statement Q1 2026 - deutsche-boerse.com
- China's cultural sector revenue up 6.4 pct in Q1-Xinhua
- news release
- The 5 Most Interesting Analyst Questions From Regions Financial’s Q1 Earnings Call
- PDF Marsh 1Q 2026 News Release
- Johnson Controls International plc Q2 2026 Earnings Call Summary
- PDF Bank of England Monetary Policy Report - April 2026
- Mohawk (MHK) Q1 2026 Earnings Call Transcript
- Tracking Chinese and Russian Statements on the Iran War
- Iran conflict 2026: Disruption to Strait of Hormuz increases energy and food production risks
- Regional Disruption, Force Majeure, and Delay Analysis: Preserving Program Integrity and Project Records
- Macroeconomic and financial impact of conflicts: a study of the ...
- Q1 Earnings Outlook Across Key Sectors and the Rising UK Inflation Challenge
- IEA Chief: Two-Year Recovery for Middle East Energy Markets
- Daewoo Engineering & Construction Co., Ltd (047040) Future Performance Analysis | KoalaGains
- Navigating Sectoral Polarization and Geopolitical Shocks: Insights and Strategies from Q1 CY2026 Earnings Analysis
- PDF TAAG Talking Points | April 2026 - mcb.com
- Fund Call | Calm capital compounding
- iShares China Large-Cap ETF | IZZ | -
- PDF Report to Shareholders for the First Quarter, 2026 - CIBC
- Navigating Sectoral Divergence and Strategic Innovation: ARK Invest’s Pivotal Shift from Bitcoin ETFs to Crypto Infrastructure Platforms in Q1 2026
- PDF Investment Outlook - rockstead.com
- Letter Template For Quarterly Investment Summary Report - Free Samples in PDF | Letterin
- Q1 2026 Institutional Investment Flows and Market Trends Impacting ETFs and GE Vernova Energy Stocks
- SkyWest Q4 2025 Earnings Summary
- PDF Korea: From "discount" to re-rating - wealth.db.com
- The 2023 Asia-Pacific Value Creators Report
- PDF Corporate Earnings Monitor Q1 2025 - imfconnect.org
- PDF Leverage and Firm Performance: Empirical Evidence from East Asia China ...
- Capital Market Review
- ANALYSIS OF SIGNAL ACCURACY FROM TECHNICAL ...
- Introducing the LSEG ESG Scores
- annual report
- Global Equity Markets Traded Mixed Amid U.S. Tariff ...
- 基金表現概覽FUND PERFORMANCE REVIEW
- First Quarter 2026
- The new energy shock: economic scenarios and policy implications
- PDF 1Q26 Earnings Supplement - JPMorgan Chase & Co.
- AudioCodes Reports First Quarter 2026 Results
- PDF Financial Stability Review - Reserve Bank of Australia
- Altria Reports 2026 First-Quarter Results; Reaffirms Full-Year Guidance
- Sandisk Reports Fiscal Third Quarter 2026 Financial Results | Sandisk
- PDF Q1 2026 Press Release Standard Chartered - sc.com
- DeepSeek-R1 Thoughtology: Let's think about LLM ...
- Prices and Volumes: Why Russian exports seemed invulnerable to sanctions and why they look vulnerable now
- PESTLE Analysis of STX
- Russia sharply reduces oil production as US sanctions impact export demand — Novaya Gazeta Europe
- PDF The Ripple Effect Of The Russia-Ukraine War: Impact On Global ...
- MD Medical Group
- 2022 ANNUAL REPORT
- The Economic Impact of the Russian-Ukrainian War on the ...
- The Impact of the Regional Military Conflict in Global Stock ...
- Strategic Trade Review
- BOFIT Forecast for Russia 2024–2026
- Q1 2026 Corporate Earnings and Industrial Capital Realignment Amid Energy Market Turbulence and AI-Driven Growth
- Earnings Resilience and Sectoral Divergence in 2026: Navigating Growth Dynamics Across Technology, Industrial, and Healthcare Sectors
- Q1 2026 Earnings Season: Navigating Resilience Amid Geopolitical Volatility and Sectoral Divergence
- Corporate Resilience and Institutional Crypto Adoption: Navigating Market Volatility with Strategic Innovation in 2026
- Q1 2026 Earnings Outlook: Sectoral Divergence, AI-Powered Tech Leadership, and Strategic Market Positioning
- Q1 2026 Strategic Sectoral Review: Industrial Resilience, Healthcare Stability, AI Expansion, and Automotive Innovation
- Q1 2026 Sectoral Earnings Analysis: Divergence, Digital Transformation, and Strategic Outlook Across Industrial, Healthcare, and Mining Sectors
- Mixed Q1 2026 Earnings Reveal Divergent Sector Strengths Amid Global Uncertainty: Technology Innovation vs. Industrial Resilience
- U.S. Economy Grows 2% in Q1 2026, But Inflation Surges to 4.5% — Highest in Over Three Years
- Nigeria: Manufacturing Output Declines As Higher Fuel Costs Slow Growth - Report - allAfrica.com
- XOM Q1 Deep Dive: Operational Flexibility and Portfolio Diversity Amid Global Energy Disruptions
- PDF World Energy Investment 2025 - 10th Edition
- PDF Abridged version - data.bloomberglp.com
- PDF What 2025-2026 Tells Us About the Future of Global Energy
- Shell’s 2026 SOFC Strategy for Maritime Innovation - EnkiAI
- The Oil and Gas Industry in Net Zero Transitions
- Oil, gas, and the energy transition
- Aid for Trade in action: Supporting the transition to clean ...
- Consolidated Management Report 2025
- [PDF] World Energy Investment 2024
- Mixed Earnings Outlook Across Sectors: Navigating Varied Q1 2026 Prospects Amid Geopolitical and Technological Forces
- Mixed Q1 Earnings and Cautious Outlooks Mark Varied Sector Performances in Early 2026
- AI-Driven Transformation and Sectoral Dynamics: A Comprehensive Analysis of Q1 2026 Financial Performance and Strategic Outlook
- Q1 CY2026 Cross-Industry Financial Performance & Strategic Trajectories: Insights from Financial Services to AI-Driven Technology Ecosystems
- Economy in strong growth momentum in Q1 - Chinadaily.com.cn
- 4 Industrial Stocks Set to Outshine Q1 Earnings Estimates
- China’s industrial profits hit 6-month high amid Iran war price spikes
- Largest Electronics Companies by Market Cap 2026
- PDF Colorado Economic and Revenue Outlook March 2025
- Trump Tariffs : Samsung Electronics Supply Chain Disruption
- PDF U.S.-China Economics and Trade Relations (Year in Review)
- PDF Silicon Showdown: The U.S. China Semiconductor Standoff and Its Global Stakes
- Global Passive Components Industry Outlook (2025–2030)
- trade war impact on global supply chain management ... - RJPN
- The Long-Term Impact of Steel Tariffs on U.S. Manufacturing
- [SMM Analysis] Impact of US Tariffs on China on the Export Methods and Prices of China's ESS Battery Cells to the US - Exploring Three Methods: "Direct Export from China, Re-export via Malaysia, and US Domestic Production" (Part II) - Shanghai Metals Market (SMM)
- FEDS Note: Detecting Tariff Effects on Consumer Prices in Real Time – Part II
- Navigating the AI Investment Boom: Key Growth Stocks and Smart Strategies for Q2 2026
- AI Investment Activity to Surpass $650 Billion Annually as Enterprise Adoption Accelerates Toward 2026 | AI Magazine
- How Might AI Change the Workplace? Evidence from Corporate Executives
- 2026 Goals for AI & Technology Leaders | IBM
- How Does AI Reduce Costs? Effective Strategies for Businesses in 2025 | Akveo Blog
- Video Summary - Deloitte CTO on the AI Investment Trap: CIO Advisory 2026
- 2026 Investment Outlook &Themes
- PDF 2026 Year-Ahead Investment Outlook - am.jpmorgan.com
- PDF The AI Infrastructure Investment Shift: From Hype to ROI
- Best AI Stocks to Buy in 2026: Top 7 Picks for Massive Growth
- Margin compression squeezes corporate earnings
- PDF International Journal of Social Science and Economic Research
- PDF BANKING ON TECHNOLOGY - National Bureau of Economic Research
- Establish benchmarks for comparing industrial returns | HelloLandMark
- the roles of competitive congruence and strategy coherence in ...
- Key Metrics for Analyzing Financial Performance - FasterCapital
- CSA Methodology Handbook 2026 – ATX industry
- Factors affecting IFRS adoption in listed companies
- PDF Defining, measuring sustainability practices life sciences industry
- CSA Methodology Handbook 2026 – TLS industry
- Energy: Sector risk analysis and economic outlook | Coface
- PDF Oil Market Report
- Q1 2026 Market commentary
- PDF 13 August 2025 - iea.blob.core.windows.net
- Oil Market Report
- Iran Conflict Impact on Oil Prices: Market Analysis
- Swelling Supply to Keep Oil Prices Under Strain in 2026 - Energy News, Top Headlines, Commentaries, Features & Events - EnergyNow.com
- What will WTI Crude Oil (WTI) hit in April 2026?
- [PDF] Strategy Report - January 2026 Investors' Guide to FY26
- PDF Strait of Hormuz Disruption and the New Geopolitics of Energy Flows
- PDF Why Do Net Interest Margins Behave Differently across Banks as Interest ...
- PDF Economic Brief - Richmond Fed
- PDF Banks' net interest margins and interest rate ... - De Nederlandsche Bank
- PDF Banks' Net Interest Margin and the Level of Interest Rates
- PDF Bank of England Monetary Policy Report November 2024
- China's evolving reserve requirements, November 2011
- Mainland China Banking Survey 2021
- PDF Global Financial Stability Report
- PDF Chinese Mainland Banking Survey 2024 Summary - KPMG
- Private sector banks report pressure on profits in Q3 amid higher provisioning, NIM pressure - The Economic Times
- PDF Q1 2026 Announcement - GSK
- PDF Table of Contents
- Q1 2026
- PDF Currency Report Card - rbcwealthmanagement.bynder.com
- January 2026 Newsletter
- PDF 2026_04_23_Sanofi_Q1_2026_Press_Release_EN1
- PDF Treasury and Federal Reserve Foreign Exchange Operations
- 2026 Outlook - Foreign Exchange Market
- Investment Outlook - Winter 2026
- [PDF] Q4 2025 Presentation - GSK
- 1 Unstoppable Vanguard ETF to Buy and Hold for the Next Decade
- Indian Stock Market Trends Today (May 4, 2026): Sensex, Nifty 50, Economy & Top Stock Picks — Your Complete Monday Market Briefing - Dailyfinancial
- S&P 500 Earnings Season Update: May 1, 2026
- First Trust Market Commentary Blog - Cash Flow and Carey
- Sector Market Perspectives: Q2 2026 | State Street
- Wall Street loses momentum? 🚩 Highlights from the S&P 500 earnings season
- Turnover: Data Reports 2026
- 2026 Real Estate Outlook: Better Times Ahead - Financial Samurai
- Employee Turnover Rate: Calculate and Reduce It Effectively
- PDF Research Paper 2026 Legacy Modernization Trends Report
- Gartner Forecasts Worldwide IT Spending to Grow 13.5% in 2026, Totaling $6.31 Trillion
- IT spending to grow 13.5% in 2026 to $6.32 trillion: Gartner
- MT_Industry-Report25.pdf
- KeyBanc’s new IT VAR survey is bullish for these stocks
- GAO-25-107795, INFORMATION TECHNOLOGY: Agencies Need to Plan for Modernizing Critical Decades-Old Legacy Systems
- Legacy System Modernization Strategies: 5 Moves to Break Free from Technical Debt | Vantage Point
- Legacy Software Modernization Statistics in 2026
- Cybersecurity Spending Hits $244 Billion in 2026 — Where Is the Money Actually Going? - Signisys
- The AI-Powered Legacy Modernization Playbook
- Q1 2026 Corporate Earnings Outlook: Divergent Sectoral Trajectories in Healthcare, Insurance, and Consumer Markets
- Navigating the Divergent Earnings Landscape of Q1 2026: Cyclical Robustness, Defensive Anchors, and Consumer Normalization Amidst Geopolitical Volatility
- PDF How Oil Shocks Propagate: Evidence on the Monetary Policy Channel
- Q1 2026 Earnings Insights: Strategic Breakthroughs and Sectoral Shifts Shaping Competitive Landscapes
- Q1 2026 Earnings Momentum: Technology and Financial Services Powering Sustained Market Outperformance Amid Sectoral Divergence
- PDF Strategic Sector Selector Trav & Leis Implied dividend growth ... - Invesco
- KOSPI Under Fed Rate Shifts: How Will Korean Stocks React?
- ESSAYS ON BUSINESS CYCLES AND THE CAUSES ...
- Navigating the Q1 2026 Economic Crossroads: Corporate Earnings Resilience Amid Federal Reserve Policy and Geopolitical Volatility
- Asset Prices and Demand Shocks
- Currency carry trades in Latin America
- Agenda And Criteria For Financial Regulatory Reform
- Agenda and Criteria for Financial Regulatory Reform
- Central Bank Divergence in 2026: Why the Fed, ECB, BoJ, and BoE Are Moving in Opposite Directions - maseconomics
- PDF World Trade Report 2024 - Trade and inclusiveness: How to make trade ...
- Federal Reserve Holds Rates at 4.25–4.50% as Two Governors Dissent
- Global Currency and Economic Market Analysis Amid Shifting Monetary Policies
- PDF For the three months ended March 28, 2026 Q1 Report 2026
- PDF Q1 2026 Results Presentation (with Appendix) - bms.com
- PDF JHL - cdn.prod.website-files.com
- Has pay kept up with inflation? - The Hamilton Project
- TECK Q1 2026 News Release
- Lilly reports first-quarter 2026 financial results, raises full year guidance, and highlights momentum of new medicines
- PDF Axis Bank Q1FY26 - Investor Presentation
- Investor Update
- KPI Dashboard
- 2026 Q1 Report: Global Trends in Biopharma Transactions – Locust Walk
- PDF PORTFOLIO - top1000funds.com
- PDF Q1 2026 Market Summary - withumwealth.com
- PDF IIssue No. 53ssue No. 53 Markearkett Point
- PDF Chinese Mainland and Hong Kong IPO Markets: 2026 Q1 Review
- Q1 2026 - PGIM
- TSMC Q1 Earnings Surge 58% as AI Demand Drives Record Profits and Raised 2026 Outlook
- Big Money Moves: 11 large-cap stocks where institutional investors raised stakes in Q4FY26 - Institutional Stake Rise | The Economic Times
- AI-Quantum Supercycle: 4 Stocks to Watch in April With 50%+ Upside
- PDF A Guide to Hedge Accounting - Rsm Us
- PDF Corporate FX hedging: An introduction for the corporate treasury
- The price, real and financial effects of exchange rates
- Management's report on internal control over financial ...
- Table of Contents 1
- How do Global Portfolio Investors Hedge Currency Risk?*
- A MILESTONE YEAR OF PROGRESS
- PDF How do Global Portfolio Investors Hedge Currency Risk?
- Annual Report 2024
- Financial Results for the Fiscal Year Ended March 31, 2025
- Global economic conditions survey report: Q1, 2026
- Cybersecurity and digital resilience: The 2026 outlook for governance
- Persimmon FY2025 results announcement
- annual-report-and-accounts-2021.pdf
- U.S. Public Sector Under Siege: Threat Intelligence for Q1 2026
- Rebuilding Together
- PDF Climate Risk Analysis for Switzerland - infras.ch
- PDF Handbook: Financial statement presentation
- California’s 2026 Climate Reporting: What You Need To Know
- Stunning US profit strength ignites stocks' charge to record peaks
- PDF Economy - hai.stanford.edu
- Artificial Intelligence – Bubble or Boom?
- Cloud AI Today - Generative AI Revolutionizing Chemical Industry Growth
- Expert AI Agency | AI Marketing Agents Singapore - Hashmeta.ai
- Artificial Intelligence (AI) Market Projected to Exceed $3.68 Trillion by 2034
- Generative AI Trends 2026: The Future of Work & Life
- Generative AI Market Trends, Share and Forecast, 2026-2033
- Generative AI Market Size, Share & Growth Report, 2034
- First quarter 2026 results | News and insights | Home
- PDF First Quarter 2026 Results and Key Metrics
- Grocery Market Size & Share | Industry Analysis [2035]
- PDF Ralph Lauren Reports First Quarter Fiscal 2026 Results Exceeding ...
- PDF Cytonn Q1'2026 Markets Review Executive Summary: Global Markets Review ...
- Consumption momentum accelerated in FY26, mid to high single growth expected in FY27 : RAI
- Nike, Oracle, FedEx are part of Zacks Earnings Preview
- Analyzing the Energy Sector's Strong Earnings Outlook
- PDF Monetary Policy Report
- PDF Financial Stability Review, May 2025 - European Central Bank
- PDF Understanding Weak Capital Investment: The Role of Market Concentration and Intangibles
- Regional Study on Labour Productivity in ...
- Book of Proceedings
- Occupational Health: The Global Evidence and Value
- Industry & Macro: A Guide on Plants, Labor
- ADVANCING YOUTH EMPLOYMENT
- Global Productivity Trends Drivers and Policies
- [PDF] Structures and Problems for Measuring Agricultural Productivity