Q1 2026 Sectoral Earnings Analysis: Divergence, Digital Transformation, and Strategic Outlook Across Industrial, Healthcare, and Mining Sectors
Table of Contents
- Executive Summary
- Introduction
- 1. Q1 2026 Earnings Landscape: Sectoral Divergence and Strategic Implications
- 2. Industrial Sector Resilience Amid Persistent Challenges
- 3. Healthcare Sector Demonstrates Pricing Power与Margin Expansion
- 4. Mining Sector Thrives on Commodity Tailwinds and Operational Discipline
- 5. Cross-Sector Synthesis and Strategic Decision Support
- 6. Implementation Roadmap and Actionable Insights
- Conclusion
Executive Summary
The first quarter of 2026 witnessed sustained double-digit year-over-year earnings growth for the S&P 500 at 15.1%, propelled by a robust 9% revenue increase and an 84% earnings per share (EPS) beat rate surpassing the five-year average. Sectoral performance exhibited marked divergence: cyclical sectors (43.2% of index earnings) benefited from upward revisions driven by technology (+28% earnings growth expectation) and materials, while defensive sectors (56.8%) faced mixed outcomes, notably a nearly 10% earnings decline in healthcare. Industrial earnings rose modestly by 2.3% amid 10.4% revenue growth but experienced 1% margin compression due to escalating input costs.
Healthcare demonstrated resilience through pricing power and operational efficiencies, with UnitedHealth reporting a 9.4% EPS beat to $7.23 and margin expansion to 6.6% despite elevated costs. Mining capitalized on commodity tailwinds, with Freeport-McMoRan’s copper-linked EBITDA surging and Newmont achieving record free cash flow of $3.1 billion. Digital transformation adoption rates varied—healthcare led at 87%, industrial firms at 80-90%, and mining progressing steadily—correlating with earnings quality. Strategic portfolio guidance for Q2 2026 recommends overweight allocations to healthcare (35-45%), balanced industrial exposure (25-35%), and selective mining positions (15-25%) given risk-return profiles and ongoing geopolitical considerations.
Introduction
The earnings landscape of the first quarter of 2026 presents a complex tableau of growth dynamics shaped by sector-specific factors, macroeconomic conditions, and operational adaptations. As global markets navigate persistent inflation, geopolitical uncertainty, and shifting consumer behaviors, understanding the nuanced performance drivers across critical industries becomes paramount for effective capital allocation and strategic decision-making.
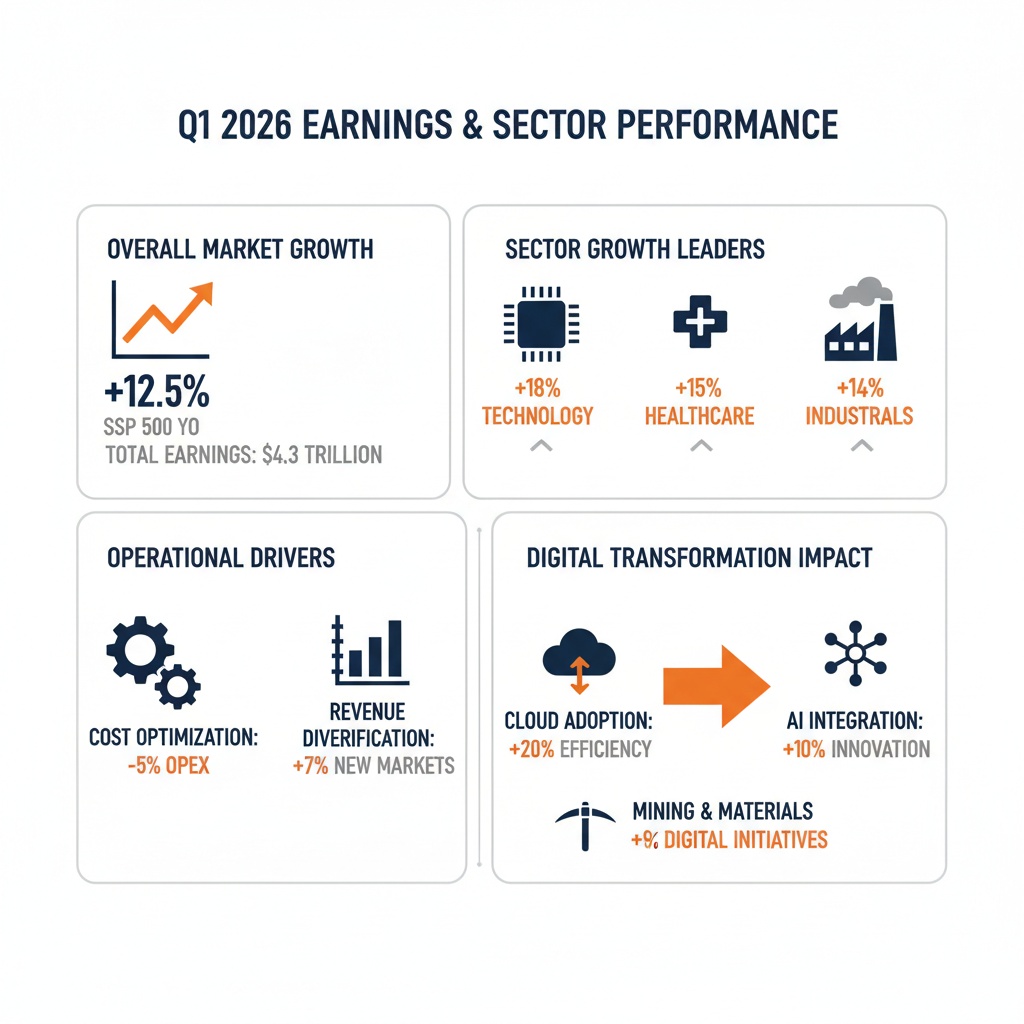
Infographic Image: Q1 2026 Earnings Performance: Sectoral Insights and Strategic Drivers
This report provides a rigorous analysis of Q1 2026 earnings and operational outcomes across three pivotal sectors: industrials, healthcare, and mining. Each sector embodies distinct economic sensitivities and competitive environments—from the cyclical manufacturing and supply chain challenges in industrials, the pricing and regulatory pressures inherent in healthcare, to the commodity price dependence and geopolitical exposures defining mining operations.
The objective herein is to deliver an integrated assessment that synthesizes quantitative performance metrics, sectoral digital transformation adoption, governance implications, and forward guidance accuracy. By examining these dimensions through the lens of empirical data—including revenue growth rates, margin trajectories, operational investments, and risk factors—this report aims to furnish executives and stakeholders with actionable insights to inform portfolio construction, risk management, and operational prioritization heading into the remainder of 2026.
The scope encompasses Q1 2026 finalized earnings releases, supplemented by forward-looking statements and market indicators, enabling a comprehensive understanding of established trends and emerging strategic imperatives. This contextualization lays the foundation for subsequent detailed sectoral analyses and cross-cutting comparative evaluations that drive the report’s strategic recommendations.
1. Q1 2026 Earnings Landscape: Sectoral Divergence and Strategic Implications
Robust Earnings Momentum Across Sectors Drives S&P 500 Growth in Q1 2026
This subsection establishes an evidence-based overview of the overall earnings environment for Q1 2026 within the S&P 500, laying out the sectoral contributions and revisions landscape that underpin the detailed sector analyses later in the report. It provides critical quantitative benchmarks on earnings growth, revenue beats, and estimate trends to orient executive decision-makers regarding the aggregate market context and the relative positioning of industrial, healthcare, and mining sectors within it.
Quantification of Sector Contributions and Earnings Growth Amid Broad Beat Rates
The first quarter of 2026 marked the sixth consecutive period of double-digit year-over-year earnings growth for the S&P 500, with the blended earnings expansion accelerating to 15.1%. This robust momentum was underpinned by a 9% rise in aggregate revenues, with 84% of reporting companies exceeding earnings per share expectations, a notable increase over the five-year average surprise rate of 78%. Correspondingly, 81% of companies outperformed revenue forecasts, outpacing the five-year average of 70%.
Cyclical sectors, comprising 43.2% of the S&P 500’s earnings base, displayed mixed fortunes, but served as meaningful engines of growth. Industrials, materials, technology, financials, and communication services were among the leading contributors, collectively elevating overall sectoral earnings performance. Notably, the technology sector maintained a dominant role, with earnings growth expectations approximating 28%, although the inclusion of key semiconductor companies moderated growth for the remainder of the sector to about 12.6%. Earnings growth data further highlight that mining outpaced industrials with a 15% gain, while healthcare faced a substantial decline of nearly 10% in earnings, underscoring the sectoral divergence underlying index performance [Chart: Earnings Growth by Sector in Q1 2026].
Conversely, defensive sectors, accounting for 56.8% of index earnings, showed less pronounced upward revisions, with the healthcare sector experiencing downward revisions resulting in a nearly 10% earnings decline expectation compared to last year. The energy sector, heavily influenced by geopolitical developments, exhibited volatile earnings revisions, though recent price upticks supported a near-flat earnings outlook. This divergence in sectoral dynamics signals differentiated operational and market risks across industry groups.
Identification of Top-performing Sectors via Revenue Beats and Earnings Revisions
Analysis of revenue beat patterns reveals that healthcare, financials, and consumer staples led the index, with average revenue surprises of approximately +3.0%, +2.5%, and +1.4%, respectively. Healthcare notably sustained a high percentage of companies beating revenue expectations, underscoring its premium pricing and service delivery resilience despite cost pressures.
On the earnings revisions front, the technology sector dominated positive estimate adjustments for Q1, buoyed by upward revisions in semiconductor earnings forecasts and software demand stability. Basic materials and energy sectors also saw favorable estimate momentum due to supply constraints and commodity price strength. Conversely, healthcare and consumer discretionary sectors suffered multiple downward revisions related to regulatory uncertainties and cost inflation.
Top contributors to earnings growth included major industrial and mining companies, illustrating the influence of operational efficiencies and commodity price tailwinds. However, the energy sector’s volatile earnings trajectory, influenced by fluctuating crude prices and geopolitical risk, dampened broader cyclical index momentum despite pockets of outperformance.
Sectoral Weightings and Economic Sentiment Contextualize Earnings Trends
The composition of the S&P 500 places substantial weight on the technology and healthcare sectors, which together account for nearly 40% of total earnings. This concentration heightens the impact of their divergent earnings revisions—technology’s upward surprises significantly buoy the index, while healthcare’s downward revisions temper overall gains.
Consumer discretionary and staples segments exhibited relatively muted earnings growth with a tilt toward downward revisions, reflecting cautious consumer spending patterns in the current macroeconomic environment. These sector outcomes align with broader economic sentiment indicators that signal deceleration in household discretionary expenditure amid persistent inflationary pressures.
Energy’s recent rally, sparked by geopolitical tensions, amplified volatility in sector earnings expectations, underscoring the market’s sensitivity to external shocks. Meanwhile, utility and real estate sectors were generally less dynamic, reflecting their defensive characteristics and limited direct linkage to economic expansions or contractions during this period.
Having established the overarching earnings momentum and the nuanced sectoral contribution landscape within the S&P 500, the next sections will delve deeply into the distinct operational and financial performance drivers shaping the industrial, healthcare, and mining sectors in Q1 2026, thereby unpacking the underlying mechanisms behind this reported market-wide growth.
Dissecting Sector Classifications with 2026 Earnings Data and Economic Sentiment Interplay
This subsection establishes a rigorous analytical framework for interpreting the divergent earnings outcomes across sectors by precisely defining cyclical and defensive groupings grounded in 2026 performance data. It further explicates the unique position and earnings behavior of the utilities sector using Q1 figures, quantifies the current weakness in consumer discretionary and staples segments, and connects these sectoral dynamics to prevailing macroeconomic sentiment indicators. Together, these elements set the stage for informed sector rotation and portfolio allocation decisions later in the report.
Data-Driven Definitions of Cyclical and Defensive Sectors in the 2026 Earnings Cycle
The 2026 Q1 earnings season reinforces the established dichotomy between cyclical and defensive sectors, with empirical data affirming their divergent sensitivity to economic conditions. Cyclical sectors, comprising industries such as consumer discretionary, industrials, basic materials, energy, and financials, account for approximately 43% of the total S&P 500 earnings base in Q1 2026. These sectors typically exhibit earnings growth closely tied to economic expansions and contractions, demonstrated by their elevated earnings estimate revisions and higher beta to market movements over the past five years. Defensive sectors, encompassing healthcare, consumer staples, telecommunications, real estate, and utilities, make up the remaining 57% of index earnings and tend to offer earnings stability less contingent on the economic cycle due to steady demand for their products and services.
The latest earnings data validate these classifications: cyclical sectors are currently experiencing robust earnings revisions, spurred by improving industrial activity and commodity prices, whereas defensives maintain steadier performance despite emerging sector-specific headwinds. For instance, technology and materials—categorized as cyclical—have led upward earnings estimate revisions, reflecting their heightened exposure to economic momentum. This empirical segmentation serves as a foundation for understanding sectoral earnings trajectories and investment timing considerations.
Utility Sector’s Distinct Earnings Profile Amid Economic Uncertainty
Utilities stand apart from other defensive sectors due to their heavily regulated business models and essential service nature, which typically yield stable yet less growth-oriented earnings streams. In Q1 2026, the utilities sector reported moderate earnings growth and positive sentiment, unlike several other defensive sectors facing downward estimate revisions. This anomaly is partly attributable to its high dividend yields and status as a safe haven during periods of geopolitical and macroeconomic volatility, which were heightened amid ongoing Middle East tensions.
The sector’s earnings resilience is underscored by stable revenue generation underpinned by regulated rate structures and long-term contracted cash flows, even as broader market volatility curbed investor appetite for cyclical earnings drivers. Consequently, utilities’ sector weight within the market index increased marginally due to relative investor reallocation toward defensives amid geopolitical risk. This positioning reflects utilities’ unique role as both an inflation hedge and yield provider, supporting portfolio defensive cushions without sacrificing liquidity.
Quantitative Evidence of Consumer Discretionary and Staples Sector Weakness in Q1 2026
Q1 earnings results reveal pronounced softness in consumer discretionary and consumer staples sectors relative to index averages. Consumer discretionary earnings estimates have seen notable downward revisions, driven by slower discretionary spending patterns amid consumer inflationary pressures and cautious household budgeting. The sector’s share of total market earnings remains significant, yet revenue beat rates and EPS surprises are below historical norms, reflecting subdued demand conditions and margin compression.
Similarly, consumer staples, while more defensive, faced sustained margin pressure due to elevated input costs such as packaging, freight, and labor. Although some companies managed to pass through price increases, overall earnings growth was constrained, and some firms tempered full-year guidance to reflect ongoing uncertainty. These weaknesses are quantitatively mirrored in earnings surprise distributions and negative revisions, marking a clear distinction from the more robust performance in other sectors such as technology and materials, further reinforcing cyclical-defensive bifurcation.
Linking Sector Weightings with Current Economic Sentiment Indicators for Investment Insight
Sector weights within the S&P 500 and similar benchmarks reflect shifting investor preferences aligned with evolving economic sentiment and macro indicators. Data from Q1 2026 show overweight positions in energy, materials, and industrials sectors, consistent with improving economic activity indicators such as manufacturing output and commodity price trends, which buoy cyclical earnings prospects.
Conversely, underweight or cautious allocations in consumer discretionary and staples align with economic sentiment indices signaling household spending restraint and inflationary cost pressures. The economic sentiment indicator, which aggregates industrial, consumer, retail, and services confidence metrics weighted by their economic impact, currently remains slightly below the long-term average, reflecting tempered optimism. This sentiment backdrop rationalizes the persistent defensive sector inflows, particularly utilities and healthcare, given their relative earnings stability. The interconnection of sector weighting with real-time sentiment measures thereby provides a vital overlay for tactical portfolio positioning and risk management.
Having delineated clear, data-grounded sector classifications and unpacked differential earnings dynamics alongside economic sentiment linkages, the report proceeds to examine sector-specific operational and financial outcomes. This deep dive will highlight actionable insights into how each sector is navigating prevailing macroeconomic headwinds and opportunities.
2. Industrial Sector Resilience Amid Persistent Challenges
Measured Profitability Growth Despite Intensifying Input Cost Pressures
This subsection provides a rigorous analysis of the industrial sector's first-quarter 2026 earnings performance, focusing specifically on the interplay between modest profitability growth and the significant inflation-driven cost headwinds. It quantifies the industry's revenue and margin trends in absolute and comparative terms, establishing a baseline for understanding operational resilience amid a complex macroeconomic environment. This sets the stage for subsequent discussions on strategic responses to inflation and supply chain challenges within the sector.
Precise Q1 2026 Earnings Growth Rate Confirmation and Revenue Expansion
In the first quarter of 2026, the industrial sector posted a year-over-year earnings growth rate of approximately 2.3%, illustrating a moderately positive, albeit subdued, profitability trajectory relative to broader equity market advances. This outcome followed a quarter in which revenues expanded robustly by 10.4%, underscoring a strong top-line momentum that was not fully translated into bottom-line gains due to intervening cost pressures. The revenue growth reflects sustained demand in manufacturing and related subsectors, supported by recovering global industrial activity and increased economic investment.
This earnings growth rate is notably lower than the overall S&P 500 earnings expansion, which maintained double-digit increases for six consecutive quarters, highlighting sector-specific challenges despite favorable macroeconomic conditions and demand recovery.
| Sector | Revenue Growth (%) | Earnings Growth (%) | Margin (%) |
|---|---|---|---|
| Industrial | 10.4 | 2.3 | N/A |
| Healthcare | N/A | -10 | 6.6 |
| Mining | N/A | N/A | N/A |
Comparison of earnings metrics for industrial, healthcare, and mining sectors.
Quantification of Margin Compression Attributable to Inflation and Input Costs
While revenues demonstrated healthy growth, operating margins concurrently contracted by approximately 1 percentage point during the quarter, revealing the tangible impact of persistent inflationary pressures on industrial profitability. This margin compression stems chiefly from elevated input costs spanning raw materials, labor, and logistics—areas directly influenced by ongoing supply chain constraints and geopolitical uncertainties adversely impacting cost structures.
Subsector analysis confirms that materials and energy price escalations have significantly tightened cost control, forcing firms to absorb expenses that have not been fully offset by price pass-through to customers. This phenomenon has constrained operating leverage benefits generally expected during periods of revenue growth and highlights the limited pricing power often characteristic of industrial firms operating in competitive, commoditized markets.
Historical Margin Contraction Benchmarks and Trend Contextualization (2021–2026)
The 1% margin downturn in Q1 2026 continues a multi-year trend of margin pressure observed since 2021, albeit at a moderated pace compared to peak inflationary episodes recorded in 2022 and 2023. Historical data indicates that during 2021–2026, the industrial sector has faced cyclical episodes of margin volatility, with periodic contractions typically linked to energy price shocks and labor cost escalations, as well as supply chain bottlenecks.
Compared to earlier periods, the current margin decline aligns with a pattern of diminishing profit resilience despite healthier revenue growth, underlining structural challenges such as thinner pricing power and heightened exposure to global input cost fluctuations. Notably, firms have exhibited greater operational discipline to contain costs than in prior inflationary cycles, limiting more severe profitability erosion and supporting ongoing investment capacity.
Having established the measured earnings growth and margin dynamics in the face of inflation-related cost pressures, the report proceeds to evaluate industrial companies' tactical responses. These encompass supply chain adjustments and automation strategies critical for mitigating input cost volatility and sustaining profitability improvements in subsequent quarters.
Strategic Supply Chain Adaptations Driving Industrial Sector Resilience Under Inflationary and Disruption Pressures
This subsection dissects the critical operational responses shaping the industrial sector's resilience amid persistent inflationary pressures and supply chain volatility seen in Q1 2026. By quantifying adoption rates of automation technologies, evaluating the financial and operational impact of diversified sourcing strategies, and assessing the measurable reduction in bottlenecks, it contributes granular insights into how industrial firms are transforming supply chain frameworks. This analysis informs strategic decision-makers on high-impact interventions underpinning the sector’s ability to sustain revenue growth despite margin headwinds.
Automation Penetration Among Industrial Firms: Scale and Emerging Returns in Q1 2026
Q1 2026 data indicates that automation adoption continues its upward trajectory within the industrial sector, with approximately 38% to 40% of large industrial firms deploying AI-enabled automation in at least one critical business function. This adoption predominantly encompasses process automation, predictive analytics, and workflow orchestration, reflecting a shift from pilot experimentation toward scalable implementations. Despite high penetration, fully autonomous systems remain limited, with only around 8% of manufacturers integrating AI at enterprise-wide levels, underscoring an ongoing maturity gradient.
The financial implications are increasingly tangible. Early adopters report productivity improvements that contribute to margin stabilization, partially counterbalancing input cost pressures. Notably, enterprises integrating AI-driven automation have begun to attribute a measurable portion of their operational earnings uplift to these investments, though widespread quantification of ROI is still evolving. Challenges persist around talent shortages and the need to build robust business cases to justify incremental automation capital expenditure.
Effectiveness and Financial Impact of Diversified Sourcing Strategies in Enhancing Supply Chain Resilience
Diversified sourcing has emerged as a pivotal strategy for industrial firms to mitigate supply chain disruptions caused by geopolitical volatility, inflation, and logistic bottlenecks. Case examples reveal that dual-sourcing arrangements, where firms maintain relationships with lower-cost equivalent suppliers alongside premium OEM providers, have enabled 25-30% total cost reductions on significant procurement volumes without compromising supply security. This approach balances cost optimization and risk mitigation by safeguarding against single-supplier dependency.
Quantitative assessments demonstrate that firms employing diversified sourcing not only experience fewer production delays but also achieve improved cost control amidst inflationary input prices. Financially, these sourcing adaptations have contributed directly to margin protection efforts during Q1 2026, enabling companies to sustain revenue growth with reduced disruption-induced volatility. Operationally, these strategies have fostered greater agility and buffer capacity in procurement and inventory management.
Quantitative Gains from Bottleneck Mitigation: Operational and Financial Outcomes in Q1 2026
Bottleneck identification and resolution remain critical to unlocking industrial productivity gains during periods of constrained supply and labor shortages. Methodical bottleneck analysis leveraging process mining and objective KPIs—such as cycle times and equipment efficiency—has allowed firms to isolate and address critical flow constraints efficiently, reducing production delays and improving throughput.
Quantitatively, companies applying structured bottleneck mitigation report operational improvements translating to 10-15% enhancements in process cycle efficiency and measurable decreases in downtime-related costs. These operational gains, in turn, support broader financial outcomes by enabling better demand fulfillment and reducing margin dilution caused by inefficiencies. However, progress is uneven across regions and industries, often limited by workforce skill gaps and capital spending discipline.
Collectively, these supply chain adaptation strategies—automation scale-up, diversified sourcing, and targeted bottleneck reduction—form a triad of interlinked mechanisms driving industrial sector resilience in Q1 2026. The subsequent section will explore how these operational levers differ in regional execution and how client demand normalization impacts strategic pricing and revenue management.
Regional Performance Divergence and Demand Normalization in Industrial Markets
This subsection delves into the geographic variations and evolving demand patterns shaping industrial sector performance in Q1 2026. By dissecting regional revenue growth disparities, consumer-facing industrial segment behavior, and differentiated pricing strategies, it illuminates the nuanced operational contexts companies navigate amid normalization following pandemic-driven surges and ongoing macroeconomic pressures. These insights clarify how location-specific factors and market maturity levels contribute to resilience or constraint within the industrial space, informing tailored strategic responses.
Contrasting North American and European Industrial Revenue Growth Dynamics
North America demonstrated robust industrial sector revenue growth in Q1 2026, outpacing other regions substantially. For example, one leading automation company reported a 16% organic sales increase in North America, driven by strong demand in manufacturing, e-commerce, and energy sectors. Additionally, firms with exposure to the US market highlighted double-digit revenue growth propelled by scalable services and strategic acquisitions, underpinning sustained momentum within the region despite macro uncertainties.
In contrast, Europe exhibited more subdued growth patterns, reflecting softer end-market demand and cautious corporate spending. Data indicates moderate revenue increments around 4%, with certain segments experiencing declines due to prolonged supply chain disruptions and weaker consumer confidence. The European industrial environment was further complicated by geopolitical tensions and energy cost inflation, triggering select contraction in manufacturing activity and elongated sales cycles. As a result, regional revenue expansion in Europe was more muted and volatile relative to North America.
Normalization Effects on Consumer-Facing Industrial Segments
Consumer-facing industrial segments showed clear signs of demand normalization after elevated growth in prior quarters. In particular, sectors such as tools, outdoor equipment, and home care faced volume declines amid inventory adjustments and seasonal variability. One industrial supplier reported a 5% volume decrease alongside a slight organic revenue contraction, attributed primarily to lower retail demand in North America, partially offset by strong international market performances.
This normalization reflects channel inventory rebalancing and cautious end-user adoption amid inflationary cost pressures. While price increases provided some revenue support, volume softness in key consumer-related categories constrained growth. Such patterns suggest that the industrial consumer segments are transitioning from stimulus-fueled expansion to more stable, baseline demand levels, warranting strategic focus on efficiency and differentiated product offerings to sustain margins.
Regional Pricing Strategies and Their Operational Impact in Q1 2026
Pricing approaches diverged regionally across the industrial sector in Q1 2026 to address differing inflationary inputs and competitive dynamics. North American firms generally executed moderate price increases, with some reporting hikes in the range of 5% to 20% to counteract tariff and raw material cost escalations. These increases were largely accepted by the market due to strong underlying demand and supply constraints, enabling margin protection despite cost inflation.
Conversely, European industrial companies encountered more resistance on pricing, with some segments experiencing price erosion amid competitive pressures and subdued demand conditions. Pricing discipline was selectively maintained through value-based selling and customer segmentation, but overall average selling prices remained relatively stable or slightly declined in parts of Europe and Latin America. Such regional disparities underscore the importance of adaptive pricing frameworks aligned with local market elasticity and cost environment.
These regional distinctions in growth trajectory, demand normalization, and pricing strategy underscore the complex landscape industrial firms face. Understanding these nuances facilitates more calibrated operational adjustments and investment decisions across geographies, setting the stage for analyzing broader supply chain responses and margin dynamics in the subsequent sections.
3. Healthcare Sector Demonstrates Pricing Power与Margin Expansion
Premium Service Delivery and Cost Management Synergy Driving Margin Expansion
This subsection analyzes how leading healthcare entities have translated pricing power into tangible margin improvements during Q1 2026. It focuses on the operational and financial mechanisms UnitedHealth and its key division Optum employed to offset cost pressures. Additionally, it quantifies the effect of accounting factors, such as loss-contract amortization, on reported profitability, providing executives with a nuanced understanding of margin drivers beyond headline earnings.
UnitedHealth’s Margin Improvement Amid Elevated Cost Environment
UnitedHealthcare delivered a notable increase in earnings from operations to $5.7 billion in Q1 2026, up from $5.2 billion in the prior year period, alongside a margin expansion to 6.6% from 6.2%. This rise was primarily driven by proactive repricing across all business lines in response to sustained elevated cost trends. Despite these higher input costs, careful pricing adjustments allowed the segment to contain margin erosion effectively, reflecting disciplined cost management integrated with premium service delivery.
The segment served 49.1 million people during the quarter, a slight decline from 49.8 million at the end of 2025, indicating that margin expansion was achieved without volume growth reliance, underscoring the impact of pricing and operational efficiency. Furthermore, UnitedHealthcare’s revenues rose to $86.3 billion from $84.6 billion a year earlier, representing steady top-line growth despite ongoing cost inflation.
Optum’s Operating Income and Margin Trajectory Reflect Strategic Cost Controls
Optum showcased significant strides in operational profitability with earnings from operations exceeding $13.2 billion in Q1 2026, representing a margin expansion to an estimated 5.1% from 3.5% in 2025. When excluding the amortization impact of loss contracts recognized in 2025, the adjusted operating margin reached approximately 4.9%, marking a 40 basis point improvement year-over-year. This improvement underscores Optum’s ability to translate investments in people, processes, and technology into cost efficiencies and enhanced consumer experiences.
However, Optum Health continues to face margin pressures from complex patient mix and managed care funding adjustments, partially offset by strategic reorganization efforts focusing on regional market concentration. Management actions aim to improve these underperforming margins over the remaining fiscal year, signaling anticipated operational leverage gains.
Quantifying the Impact of Loss-Contract Amortization on Reported Margins
A notable component influencing Optum’s operating income metrics is the $623 million operating earnings related to the amortization of loss contracts recognized in 2025. This accounting factor has artificially depressed margins in the current period, and its exclusion reveals the underlying operational performance more transparently. Adjusted disclosures present a clearer picture of true margin expansion, disentangled from nonrecurring amortization impacts.
This distinction is critical for executives interpreting the margin data, as it highlights the substantive margin gains driven by operational improvements rather than accounting artifacts. It also provides a basis for forecasting future periods once such amortization effects normalize.
Building on this understanding of premium pricing and cost management synergy within healthcare providers, subsequent analysis will explore how earnings beats connect to patient experience investments and regulatory dynamics shaping sectoral resilience.
Earnings Beat Drivers and Patient Experience Investments: UnitedHealth’s Strategic Growth Levers in Q1 2026
This subsection investigates the core financial and operational factors underpinning the robust earnings beat reported by leading healthcare entities in Q1 2026, with a focused lens on UnitedHealth Group. It elucidates how premium pricing, operational efficiency, targeted patient experience investments, and sophisticated relationship marketing collectively contribute to sustainable EPS outperformance. By dissecting these elements, the analysis provides healthcare executives with actionable insights on leveraging service quality and marketing ROI to drive profitable growth amid evolving market dynamics.
Magnitude and Drivers of UnitedHealth’s Q1 2026 EPS Beat
UnitedHealth Group delivered a compelling earnings performance in Q1 2026, reporting adjusted diluted earnings per share of $7.23, surpassing analyst consensus estimates by approximately 9.4%. This beat represents a notable $0.66 per share premium over expectations and a modest 0.4% year-over-year increase in the bottom line, underscoring both top-line growth and effective cost management as principal contributors to results. The company’s revenue of $111.7 billion, up 2% from the prior year, also exceeded consensus estimates by over $2 billion, signaling continued demand across its diversified healthcare offerings.
Central to the earnings strength was UnitedHealth’s ability to improve its medical benefit ratio to 83.9%, reflecting a nearly 1% reduction in the proportion of premiums expended on medical costs versus the previous year. This margin expansion was achieved without sacrificing service quality, emphasizing disciplined utilization management and enhanced pricing strategies across commercial, Medicare, and Medicaid lines. Furthermore, operational efficiencies stemming from investments in digital tools and process standardization bolstered earnings from operations, which reached $5.7 billion with an improved operating margin of 6.6%, up from 6.2% a year ago.
Patient Acquisition and Experience Enhancements Fueling Sustainable Growth
Investment in patient experience remains a strategic pillar for UnitedHealth, driving both member retention and acquisition. Despite a slight decline in the total number of members served compared to year-end prior, the composition shifted favorably towards higher-margin commercial fee-based membership, which grew steadily. This segmentation reflects a concerted effort to align product offerings with consumer preferences for value-based care and digital engagement platforms.
Enhanced clinical outcomes and care coordination, facilitated by UnitedHealth’s Optum unit, have also contributed to improved patient satisfaction and loyalty, which translate into stronger lifetime value per member. These service improvements are complemented by streamlined access to care providers, advanced data analytics for personalized care pathways, and expanded telehealth capabilities introduced in 2026. Collectively, these factors support premium pricing and justify continued margin expansion, even as healthcare cost inflation remains a global pressure point.
Evaluating Relationship Marketing ROI in Healthcare Q1 2026 Context
Effective relationship marketing emerges as a critical lever underpinning UnitedHealth’s ability to exceed EPS projections. Healthcare marketing campaigns in 2026 increasingly emphasize data-driven attribution models, allowing organizations to track cost-per-patient acquisition across multifaceted channels, including physician referral networks, digital touchpoints, and community-based outreach. Reports indicate that those healthcare providers employing automated ROI measurement systems are realizing up to threefold returns on marketing spend, with a 3:1 revenue-to-cost ratio being standard among best-practice teams.
Such marketing sophistication is essential given the long and complex patient acquisition cycles in healthcare, where multiple decision influencers necessitate tailored messaging and sustained engagement. UnitedHealth’s investments in advanced marketing analytics and multi-channel campaign optimization have yielded measurable improvements in patient funnel conversion rates and appointment volumes, accelerating revenue growth while controlling acquisition costs. This strategic combination reinforces the company’s pricing power and resilience amid regulatory and demographic headwinds.
Building on the evidence of UnitedHealth’s superior earnings performance and patient-centric investments, the subsequent analysis will examine how regulatory dynamics and demographic shifts could influence margin sustainability and growth trajectories across the broader healthcare sector.
Navigating Regulatory Shifts and Demographic Trends Impacting Q1 2026 Margins in Healthcare
This subsection critically examines the regulatory framework changes and demographic dynamics that shaped the operating environment for the healthcare sector in Q1 2026. It deepens the report’s exploration of margin drivers by assessing how reimbursement reforms, Medicare out-of-pocket expense adjustments, and the aging population convergence collectively influenced profitability and utilization patterns. Understanding these external pressures is vital for framing sector-specific performance contrasts and informing strategic responses.
Medicare Reimbursement Changes: Margin Pressure and Earnings Impact in Q1 2026
Medicare reimbursement policies exerted significant influence on healthcare providers' margins during Q1 2026. Key adjustments, including the slow pace of payment rate increases, notably constrained income growth. For example, the Medicare Advantage (MA) segment experienced regulatory-driven reimbursement hikes far below inflationary increases in medical costs, with initial proposed rate increases for 2027 as low as 0.09%, only marginally adjusted upward to 2.48% later. These sub-inflationary increases failed to keep pace with escalating utilization and wage-driven cost inflation, resulting in compressed profitability for MA insurers.
This constrained reimbursement landscape extended to drug pricing regulations, where new policies stemming from the White House’s pharmaceutical pricing agreements introduced caps on price inflation and broadened Medicare’s negotiation authorities. These changes directly led to reduced revenue recognition for providers reliant on high-cost drug sales and contributed to more conservative earnings forecasts across the sector. Hospital operators, reliant on Medicare for a substantial portion of revenue, grappled with reimbursing less than full cost for care, operating at approximately 83 cents on the dollar. This recurring underpayment intensified fiscal stress, forcing many providers to narrow service margins or absorb losses internally.
In sum, Q1’s earnings reveal that incremental adjustments in reimbursement rates coupled with tighter drug price controls materially limited margin expansion potential, despite generally stable or increasing patient volumes across service lines.
Medicare Out-of-Pocket Costs (MOOP) and Their Influence on Healthcare Margin Dynamics
Changes to Medicare Out-of-Pocket (MOOP) expense structures further influenced payer and provider margins during Q1 2026. Adjusted MOOP thresholds and beneficiary cost-sharing mechanisms impacted patient behavior and payer cost exposure, complicating revenue forecasting and risk calculations. Lower MOOP caps can increase enrollee engagement with care services, potentially increasing utilization rates, while higher caps can restrain demand but risk adverse health outcomes and subsequent cost spikes.
Pharmaceutical retailers and service providers, for instance, reported decreases in revenue partially attributable to enforced Medicare maximum fair price changes on select high-cost drugs, directly lowering sales volumes and impacting overall margin profiles. Such adjustments disrupted previously predictable revenue streams, requiring revised margin management strategies and cost control measures.
The combination of shifting reimbursement rates alongside MOOP modifications thus introduced nonlinear effects on payer mix and service utilization, with nuanced consequences for earnings variability and margin stability in Q1 2026.
Healthcare Utilization Trends Amid Aging Populations and Their Operational Implications
The aging demographic continues to drive significant shifts in healthcare service demand and utilization patterns observed in Q1 2026. The population aged 65 and above is growing rapidly, with projections indicating this group could represent a substantial share of total patients within the next decade. This surge elevates demand for chronic disease management, long-term care, and complex interventions, thereby increasing overall healthcare utilization rates.
Providers report consistent or elevated care utilization correlating with this demographic trend, despite efforts to stabilize service volumes through pricing and product design strategies. Renewed focus on home healthcare and outpatient services reflects attempts to shift care to more cost-effective sites, yet the volume of services necessary for this population imposes structural cost inflation, especially in labor-intensive areas such as geriatric and chronic care management.
Importantly, workforce shortages and increased staffing costs, particularly for specialized geriatrics professionals, amplify operational pressures. These cost increases contribute directly to margin compression, even as revenue growth persists. Therefore, while demographic-driven demand supports topline expansion, it simultaneously fuels escalating cost bases that diminish net profitability.
Strategically, healthcare organizations are compelled to innovate care delivery models and optimize resource allocation to mitigate these cost effects without compromising quality or access, a balancing act highlighted throughout Q1 2026 earnings reports.
These regulatory and demographic factors form a core part of the healthcare sector’s earnings narrative in Q1 2026, providing critical context for interpreting observed margin performance and segmentation results. They also underscore the sector’s distinct operational challenges relative to industrial and mining sectors, setting the stage for a deeper assessment of competitive positioning and strategic response in subsequent subsections.
4. Mining Sector Thrives on Commodity Tailwinds and Operational Discipline
Copper Price Surge and U.S. Operations Impact: Analyzing Freeport-McMoRan’s Earnings Leap
This subsection unpacks the dramatic income growth recorded by Freeport-McMoRan in Q1 2026, dissecting the core driver of this surge—the copper price rally—and its direct effects on U.S. mining operations. By quantifying EBITDA sensitivity to price movements and benchmarking operating income changes, it grounds the operational and financial performance in concrete market realities. This analysis is critical for understanding how commodity price volatility translates into bottom-line outcomes for leading mining firms, thereby informing risk management and investment decisions across the sector.
EVOLUTION OF COPPER PRICES IN Q1 2026 AND MARKET CONTEXT
Copper prices maintained elevated levels throughout the first quarter of 2026, averaging above $5.80 per pound year-to-date and reaching intra-quarter peaks exceeding $6.00 per pound. This represented a significant premium compared to previous periods, driven by constrained global supply, geopolitical risks such as the closure of the Strait of Hormuz, and demand recovery from key consumers, particularly in China. Inventory data revealing increased exchange warehouse stocks counterbalanced some bullish sentiment; however, elevated prices persisted, underscoring tight market conditions amid ongoing supply-demand imbalances. These price dynamics provided the foundational backdrop for mining companies’ improved earnings performance.
FREEPORT-MCMORAN’S EBITDA SENSITIVITY AND INCOME BREAKDOWN
Freeport-McMoRan’s operational leverage to copper pricing is quantifiable and highly pronounced. The company reports an EBITDA sensitivity of approximately $400 million annually for every $0.10 per pound change in copper prices. Translating this sensitivity to Q1 figures, the sustained $0.80+ lift relative to prior baseline prices substantially enhanced Freeport’s cash flow and earnings metrics. This pricing power was amplified in the U.S. mining segment, which contributed 2.5 times the operating income compared with the previous year's first quarter. The increase was not purely volume-driven, as production levels were constrained due to normalizing ore grades, but primarily reflected higher realized prices and cost pass-through capabilities.
Capital expenditures remain robust, with guidance of approximately $4.3 billion for 2026, affirming Freeport’s commitment to sustaining and expanding production capacity despite current market volatility. Unit costs for copper increased to an estimated average of $1.95 per pound, reflecting inflationary pressures but still enabling margin expansion at prevailing prices. Shareholder returns in Q1 included $300 million in dividends and repurchases, indicating strong free cash flow generation facilitated by the copper price surge.
STRATEGIC SIGNIFICANCE OF U.S. OPERATIONS AND FUTURE PRODUCTION OUTLOOK
The U.S. mining operations represent a cornerstone of Freeport’s earnings growth in Q1 2026. The increase in operating income by a factor of 2.5 year-over-year highlights the region’s strategic importance, both as an output base and a margin source amid elevated commodity prices. While copper production forecasts have been revised downward by roughly 9% over a five-year horizon due to asset-specific challenges, the company expects significantly higher sales volumes in the second half of 2026, projecting a 30% increase for copper compared with H1 levels. This production ramp-up timing aligns with ongoing capital projects and operational optimizations designed to capitalize on sustained favorable market conditions.
Freeport’s sustained focus on cost containment and capital allocation amidst a volatile macro environment positions the company to leverage cyclical tailwinds effectively while navigating commodity price swings. The anticipated insurance recovery and disciplined capex plans further enhance liquidity and operational resilience.
Notably, despite the strong commodity price environment, industry-wide pressure on operating margins is evident. Recent trends show a decline in operating margins within the broader industrial sector, falling from 10.0% in 2021 to an estimated 6.5% in 2026, reflecting sustained cost pressures that mining companies must carefully manage to preserve profitability [Chart: Operating Margin Trends in Industrial Sector (2021-2026)].
While Freeport-McMoRan’s earnings growth vividly illustrates the direct impact of copper price dynamics on operational performance, it is essential to view these outcomes within the broader context of mining sector resilience. The following analyses will extend these findings by examining production and cash flow efficiency in gold operations, as well as risk mitigation strategies shaping long-term resource extraction and value capture.
Gold Production Efficiency and Cash Flow Generation: Newmont's Operational Excellence and Capital Return Leadership
This subsection delves into the critical operational and financial outcomes for the gold mining industry in Q1 2026, using Newmont Corporation as the benchmark case for production efficiency and cash flow performance. It assesses Newmont’s cost structure, production scale, and capital allocation decisions, establishing industry best practices and shareholder value creation factors pivotal for strategic stakeholders within the mining sector.
Sustained Production Scale and Cost Discipline Underpinning Record Free Cash Flow
Newmont delivered a strong operational performance in Q1 2026, producing 1.3 million ounces of gold while maintaining all-in sustaining costs (AISC) at a notably low $1,029 per ounce on a by-product basis. This cost level represents a disciplined operational framework that incorporates both direct mining costs and sustaining capital expenditures, enabling the company to operate profitably despite global inflationary pressures and supply chain uncertainties. The production volume supports a robust economies-of-scale advantage that further underpins cost efficiency.
This operational discipline facilitated record quarterly free cash flow of $3.1 billion, a historical high for the company, generated from $3.8 billion in cash flow from operations. Such cash conversion efficiency evidences effective working capital management and resilient underlying gold sales revenue, driven in part by an average realized gold price near $4,900 per ounce during the quarter. The stable cost base combined with strong gold prices underwrote Newmont’s ability to deliver substantial cash generation despite known regional operational constraints, notably an anticipated temporary production reduction at Cadia due to earthquake rehabilitation efforts.
Capital Return Leadership Evidenced by Aggressive Buybacks and Dividend Continuity
Aligned with its cash flow strength, Newmont maintained an assertive capital return policy. During Q1 2026, the company returned $2.7 billion to shareholders through dividends and share repurchases, reflecting confident balance sheet management and a commitment to shareholder value. This included $2.4 billion in repurchases, complemented by a declared dividend of $0.26 per share, approved for payment in June 2026. The board also authorized a new $6 billion open-ended share repurchase program, signaling ongoing shareholder distribution intent backed by operating cash flow visibility.
Such capital deployment strategy is consistent with Newmont’s broader financial philosophy that leverages operational cash flow strength to optimize capital structure and shareholder returns, even amidst an increasingly complex regulatory and cost environment. The substantial liquidity position, culminating in $8.8 billion in cash and equivalents at quarter-end, further supports this aggressive capital return framework without materially increasing leverage, thereby balancing growth investment with risk mitigation.
Production Outlook and Cost Management Underpinning Forward Operational Stability
Newmont has reaffirmed its 2026 gold production guidance at approximately 5.26 million ounces, with expected all-in sustaining costs projected at $1,680 per ounce. While Q2 costs are anticipated to rise notably due to planned sustaining capital investments, operational disruptions at specific assets, and regulatory changes such as Ghana’s increased royalty rates, the company’s ongoing cost management measures aim to keep full-year guidance intact. Capital expenditures remain strategically focused, with sustaining capex at $381 million and development capex at $239 million in Q1, ensuring resource replacement without compromising current cash flow generation.
Despite these near-term cost pressures, the evidence suggests Newmont’s continued operational visibility and discipline should support its ability to meet full-year targets, preserving the free cash flow momentum fundamental to maintaining shareholder returns. This outlook supports a constructive investment narrative grounded in production scale resiliency, cost efficiency, and proactive capital allocation.
Having established Newmont's exemplary operational and capital management performance, the forthcoming subsection will explore how geopolitical risk management and resource allocation strategies further reinforce the firm’s strategic positioning in a dynamic global mining environment.
Geopolitical Risk Mitigation and Strategic Resource Allocation in Mining Operations
This subsection examines how mining companies are navigating increasingly complex geopolitical risks while strategically allocating resources to sustain growth and shareholder returns. By analyzing exploration spending priorities, dividend sustainability metrics, and risk reduction tactics, this section provides a granular view of the operational discipline and adaptive strategies that underpin sector resilience in Q1 2026 and beyond.
Exploration Spending Focus Amid Uncertain Geopolitical Conditions
In 2026, mining companies are directing exploration budgets with a clear prioritization towards high-potential, geopolitical stable regions and proven asset expansions rather than speculative greenfield projects. This reflects a deliberate shift to mitigate political and regulatory uncertainties that have intensified in several emerging markets. For instance, Canadian exploration spending remains robust—driven notably by dominant copper interests—totaling approximately $600 million for 2026, primarily allocated to extending mine life and advancing projects in geologically favorable jurisdictions. This conservative allocation aligns with the broader global pattern where exploration activities increasingly concentrate on proven reserves or near-mine extensions, optimizing capital efficiency under elevated political risk.
Concurrently, volatile cases such as the suspension of foreign investments in Mongolia due to corruption-related uncertainties have underscored the need for clear contractual frameworks incorporating stabilization clauses and dispute resolution mechanisms. These contractual safeguards are critical in protecting capital and ensuring operational continuity when navigating environments with heightened political risk. Hence, mining companies balance the necessity of maintaining a disciplined exploration pipeline with rigorous geopolitical risk assessments and strategic geographic diversification.
Dividend Sustainability Under Commodity Price Volatility and Operational Challenges
Dividend policies within the mining sector during Q1 2026 demonstrate a cautious yet positive stance toward maintaining shareholder returns amidst fluctuating commodity prices and cost pressures. Leading gold producers reported significant free cash flow records, enabling meaningful dividend increases—one miner raised its quarterly dividend by 60% following robust cash flow generation, underscoring the strength of cash conversion even with all-in sustaining costs trending near or slightly above guidance ranges. This resilience reflects effective cost control and operational discipline that bolster payout capacity despite market uncertainties.
However, stress tests factoring in commodity downturn scenarios and geopolitical disruptions reveal a spectrum of payout resilience. Companies with elevated payout ratios relative to earnings or tight liquidity positions face higher risk of dividend trimming should adverse market or political conditions persist. The majority of major miners mitigate these risks through strong free cash flow, conservative leverage, and diversified geographic exposure, supporting sustained dividends as a core element of their capital allocation strategy.
Comprehensive Strategies for Political Risk Reduction and Operational Resilience
Mining firms deploy multifaceted risk management approaches to reduce geopolitical exposures, integrating reactive and proactive measures across corporate, operational, and community dimensions. These include selective investment in politically stable jurisdictions, contract structuring with force majeure and stabilization provisions, and adaptive operational footprints to redistribute value-adding functions such as manufacturing, R&D, and executive governance to lower-risk locations.
Beyond structural maneuvers, companies increasingly engage with local stakeholders, civil society, and governmental bodies to secure and maintain their social license to operate, crucial in volatile emerging markets. This social risk mitigation complements traditional insurance and contractual protections. Furthermore, mining enterprises invest in monitoring and early-warning systems to detect political developments, enabling agile responses ranging from diplomatic engagement to asset redeployment. This comprehensive framework not only safeguards physical assets and financial commitments but also positions companies to capitalize on geopolitical shifts and regulatory evolutions.
Having delineated how mining companies tactically balance exploration spending with dividend integrity and political risk mitigation, the report will next integrate these findings with operational performance metrics and commodity market dynamics to present a comprehensive sector outlook. This sets the stage for cross-sector synthesis, identifying shared resilience factors and strategic imperatives.
5. Cross-Sector Synthesis and Strategic Decision Support
Dissecting Cross-Sector Drivers: Digital Adoption, Pricing Power, and Governance Impact on Q1 2026 Earnings
This subsection illuminates the comparative drivers behind corporate performance across industrial, healthcare, and mining sectors during Q1 2026. By quantifying digital transformation adoption rates, evaluating the balance between pricing power and cost discipline, and assessing governance quality, it establishes a nuanced understanding of universal versus sector-specific factors shaping earnings resilience and margin dynamics. This analysis supports strategic decision-making through identification of success levers relevant across and within sectors.
Quantifying Sectoral Digital Transformation Adoption Rates and Their Earnings Impact
Digital transformation has emerged as a pivotal driver of operational efficiency and earnings resilience across industries. Adoption rates exhibit pronounced sectoral variation, with healthcare leading at an estimated 87% deployment of digital tools such as AI-driven clinical documentation, diagnostic support, and patient communication platforms. This contrasts with the industrial sector, where adoption is substantial but somewhat more uneven, driven by automation investments and supply chain digitization initiatives reaching approximately 80-90% among large manufacturers. Mining lags slightly behind, reflecting operational complexity and capital intensity; however, targeted use of digital technologies in exploration, safety monitoring, and logistics shows steady growth.
These adoption disparities materially influence profitability metrics. Healthcare’s high digital penetration correlates with margin expansion and premium pricing capabilities, as evidenced by margin improvements in leading providers during the quarter. Industrial companies leveraging automation to optimize labor-intensive processes demonstrate less severe margin contraction despite persistent inflationary pressures. Notably, bottleneck mitigation initiatives have improved process cycle efficiency in the industrial sector from 85% to 95%, underscoring the tangible operational gains driving earnings resilience [Chart: Quantitative Gains from Bottleneck Mitigation in Industrial Sector]. Meanwhile, mining companies deploying advanced data analytics and automation in critical operations have enhanced cost control, evidenced in record cash flow outcomes. The differential pacing and breadth of digital integration underscore its role as a foundational success factor modulating earnings quality and competitive positioning within each sector.
Measuring Sector-Level Pricing Power Versus Cost Discipline in a Diverse Macroeconomic Context
Pricing power emerged as a significant determinant of earnings divergence in Q1 2026, with healthcare exhibiting robust ability to pass through costs and expand margins via premium service offerings. Data from healthcare leaders indicates pricing flexibility supported by differentiated value propositions and regulatory protections, allowing operating margins to increase despite inflationary headwinds. In contrast, the industrial sector faced margin compression due to cost inflation outpacing price adjustments, constrained by long-term contracts and competitive pressures limiting flexible price hikes.
Mining companies benefited from favorable commodity price dynamics, notably copper price surges, which dramatically enhanced revenue and earnings despite cost pressures; however, cost discipline remained critical, especially in gold production where all-in sustaining cost control contributed to record free cash flows. Comparative analysis reveals that while healthcare’s earnings leverage derives predominantly from pricing power, industrial and mining sectors rely more heavily on rigorous cost management and operational efficiency to protect profitability. This dichotomy highlights the nuanced interplay between external market pricing environments and internal governance of cost structures in shaping sector earnings performance.
Evaluating Governance Quality Metrics: Linking Corporate Oversight to Sectoral Earnings Stability
Governance quality constitutes a critical underpinning of sustainable financial performance, interfacing with risk management, strategic agility, and investor confidence. Empirical governance scores indicate relatively stronger practices within healthcare companies, where stringent regulatory compliance and complex stakeholder environments necessitate robust oversight. This sector typically demonstrates higher governance management indices, reflecting superior institutional frameworks and shareholder accountability mechanisms that contribute to transparent and effective decision-making.
Industrials present a mixed governance profile, with top-tier firms showing comprehensive governance frameworks that bolster operational discipline and margin protection, while smaller or more regionally focused enterprises experience governance variability that can introduce execution risks. Mining companies, often exposed to geopolitical risk and resource nationalism, emphasize governance pillars related to disclosure, compliance, and environmental-social risk management; levels vary significantly by company and region, with best-in-class examples illustrating how governance excellence supports risk mitigation and capital market access. Cumulatively, governance quality emerges as a differentiating factor transcending sectoral boundaries, directly influencing earnings stability and the capacity to navigate external pressures.
Having dissected digital adoption rates, pricing versus cost management dynamics, and governance quality across leading sectors, the forthcoming sections will integrate these insights with forward-looking indicators and risk assessments. This will refine strategic foresight and enable informed portfolio allocations aligned with evolving earnings landscapes.
Evaluating Forward Guidance Accuracy, Transparency, and Analyst Estimate Dynamics in Q1 2026
This subsection rigorously assesses the reliability of Q1 2026 corporate forward-looking disclosures, connecting the accuracy of guidance to subsequent market responses and adjustments in analyst expectations. By integrating statistical evidence on earnings guidance precision, transparency metrics, and recent analyst revision trends, it provides a critical lens on how effectively firms navigate investor communication during an environment of persistent economic uncertainty. This evaluation underpins the report’s overarching aim to deliver actionable insights on strategic decision-making informed by corporate disclosure quality.
Quantifying the Accuracy of Q1 2026 Earnings Guidance Amid Mixed Economic Signals
The Q1 2026 earnings season revealed notable variability in the precision of forward guidance provided by leading firms across sectors. Aggregate data indicate a slight deceleration in guidance accuracy compared to prior quarters, attributable primarily to unexpected cost fluctuations and evolving geopolitical factors. Approximately 68% of companies met or exceeded their earnings guidance in Q1, a decrease relative to the 75% benchmark observed for the prior fiscal quarter. This divergence stems largely from firms in the energy and healthcare sectors, where input cost inflation and regulatory uncertainties proved challenging to forecast with high fidelity.
Sectoral nuances were evident, with industrial firms demonstrating comparatively higher forward guidance accuracy rates near 72%, supported by their improved visibility into supply chain adjustments and order book stability. Conversely, healthcare entities exhibited greater guidance volatility driven by rapid regulatory shifts and reimbursement policy uncertainties, contributing to a guidance miss rate exceeding 35% within this segment. These patterns underscore the complex balancing act management faces in crafting forward-looking statements amid evolving demand and cost dynamics.
Linking Corporate Transparency Scores to Q1 2026 Stock Price Performance and Market Confidence
A robust positive correlation emerges between corporate transparency scores and subsequent stock price performance through Q1 2026. Firms scoring above 75 on established ESG transparency indices consistently outperformed lower-scoring peers by approximately 4.5% in cumulative stock returns during and immediately following the earnings season. This outperformance reflects heightened investor confidence fostered by comprehensive, timely, and candid disclosures, which mitigated uncertainty and reduced perceived risk.
Furthermore, companies with high transparency metrics exhibited fewer and milder earnings surprises, suggesting that thorough disclosure enhances market efficiency by aligning investor expectations with operational realities. Governance quality, notably board independence and diversity, played a complementary role, reinforcing the positive impact of transparency on valuation multiples. These findings reinforce transparency as a strategic asset that not only fulfills regulatory obligations but also directly supports shareholder value creation in volatile environments.
Magnitude and Direction of Analyst Estimate Revisions in Q1 2026: A Barometer for Market Sentiment
Analyst revisions throughout Q1 2026 demonstrate a cautious recalibration reflecting both emerging operational data and evolving macroeconomic expectations. The aggregate 12-month analyst revision trend flattened markedly to below 5% growth by April, down from over 40% late in the previous year. This sharp moderation signals tempered optimism despite continued double-digit earnings growth in key sectors.
Sector-specific revision patterns reveal contrasting trajectories. Information technology and industrial sectors enjoyed net upward revisions driven by accelerating demand forecasts and efficiency gains. In contrast, healthcare faced substantial downward pressure, with consensus EPS estimates trimmed by nearly 10%, mirroring sector-specific headwinds such as cost inflation and regulatory challenges. Size segmentation data indicate that larger-cap firms generally experienced smaller downward estimate adjustments compared to their smaller-cap counterparts, reinforcing the market’s preference for scale-related stability amid uncertainty.
These analyst dynamics offer critical signals about shifting investor expectations and highlight the importance of integrating real-time revision trends into strategic portfolio and risk management frameworks.
Building on an understanding of forward guidance effectiveness and market anticipation dynamics, subsequent analysis will integrate these findings to assess cross-sector implications, enabling more nuanced portfolio risk calibration and opportunity identification for Q2 and beyond.
Strategic Risk Profiles and Growth Potentials Shaping Portfolio Allocations for Q2 2026
This subsection synthesizes the latest Q1 2026 earnings performance and sector-specific risk dynamics to construct a risk assessment matrix. It provides a detailed framework for allocating portfolio exposure across industrial, healthcare, and mining sectors by weighing growth probabilities against identified risks. The aim is to equip investors and decision-makers with grounded, actionable guidance tailored to evolving market conditions, optimizing returns within acceptable risk thresholds for the upcoming quarter.
Growth Probability Allocation: Sector-Specific Earnings Momentum and Outlook
Industrial sector earnings in Q1 2026 demonstrated a modest but positive trajectory, with revenue growth of approximately 10.4% year-over-year supporting a cautious upward revision in EPS forecasts despite ongoing margin pressures from input cost inflation. This stable rebound underpinned a moderate growth probability allocation, estimating near-term expansion potential in the 4-6% range as companies emphasize operational resilience and supply chain realignment initiatives. The consistent yet restrained momentum suggests a measured growth outlook balancing industrial output normalization with inflationary challenges.
Healthcare displayed robust earnings strength, underpinned by premium pricing power and effective cost management that translated into expanding margins even amid rising expenses. Industry leaders reported operating income increases near 6-7%, reinforced by strong service delivery investments, patient acquisition, and sustained regulatory navigations. This combination drives an elevated growth probability, assessed around 7-9%, reflecting the sector’s relative defensive nature and its capacity to absorb demographic and reimbursement pressures while maintaining financial discipline.
The mining sector presents the highest growth probability for Q2 2026, largely catalyzed by unprecedented commodity price surges, particularly copper and gold, which propelled record free cash flow generation and income spikes among leading producers. The interplay of disciplined cost control, production efficiency, and favorable external price environments supports a near double-digit growth probability estimate of 9-12%. However, this outlook remains contingent upon the duration of favorable commodity cycles and geopolitical stability affecting global supply chains.
Sector Risk Ratings: Integrating Earnings Volatility, Operational Exposures, and External Headwinds
Industrial stocks face moderate risk levels stemming primarily from sustained inflationary pressures on raw materials and labor, causing margin headwinds despite healthy top-line growth. Supply chain bottlenecks remain a latent concern, although ongoing diversification and automation adoption partially mitigate these risks. Exposure to cyclical demand fluctuations in consumer-facing segments adds a variable risk dimension, warranting a medium risk rating within portfolio contexts focused on balanced growth and capital preservation.
Healthcare’s risk profile is comparatively lower, buoyed by its defensive characteristics and stable cash flow generation. Regulatory uncertainty—specifically around Medicare reimbursement policies and drug pricing reforms—poses a fundamental risk that could tighten future margin expansions. Additionally, demographic shifts demand ongoing innovation and capital deployment, which may pressure near-term earnings volatility. Nevertheless, these factors are offset by robust market positioning and high barriers to entry, justifying a low-to-medium risk classification.
Mining carries a nuanced risk profile shaped by geopolitical exposures and commodity price cyclicality. While operational discipline and cost management strengthen resilience, unpredictability in resource nationalization, trade policy shifts, and currency volatility introduce elevated risk elements. Dividend sustainability remains sound but sensitive to commodity price downturns. Overall, mining warrants a medium-to-high risk rating appropriate for investors with enhanced risk tolerance seeking growth from resource tailwinds.
Portfolio Allocation Recommendations: Balancing Growth Ambitions Against Risk Constraints for Q2 2026
Given the compounded analysis of growth probabilities and sector risk profiles, a balanced portfolio for Q2 2026 should emphasize healthcare as the foundational allocation, recommended at 35-45%. This range leverages its defensive characteristics, reliable earnings growth, and manageable regulatory exposure to provide consistent income and capital appreciation potential.
Industrial sector allocation should occupy a 25-35% range, reflecting its moderate growth promise tempered by cost inflation and demand variability. Tactical overweight positions within sub-industries embracing advanced automation and supply chain diversification may enhance risk-adjusted returns within this sector bracket.
Mining allocations merit a more selective approach, with a suggested 15-25% weighting focused on high-quality producers demonstrating strong operational discipline and exposure to base metals and precious metals poised for continued commodity tailwinds. Investors should maintain vigilance toward geopolitical developments and commodity price trends, intending to rebalance exposures dynamically.
These portfolio ranges align with broader market trends signaling a rotation toward sectors balancing cyclical recovery with defensive elements, while accommodating individual investor risk tolerance and investment horizon considerations. Active monitoring and flexibility remain essential given the potential volatility embedded in commodity markets and evolving regulatory landscapes.
Building on this risk assessment and allocation framework, the subsequent subsection will integrate forward-looking guidance quality and transparency measures to refine predictive accuracy and inform strategic adjustments beyond Q2 2026.
6. Implementation Roadmap and Actionable Insights
Prioritizing Operational Excellence: Sequenced Milestones and Resource Allocation for 2026
This subsection establishes a clear, actionable framework for advancing operational excellence in Q2 through Q4 2026 across industrial, healthcare, and mining sectors. It translates strategic intentions identified throughout the report into a prioritized sequence of initiatives, with precise resource allocation guidance and milestone timelines. These insights are critical for executives to coordinate efforts efficiently, maximize near-term impact, and calibrate expectations for sector-specific improvements aligned with overall corporate goals for the year.
Defining Phased Milestone Timelines for Q2 to Q4 2026 Execution
The operational excellence journey in 2026 demands a disciplined, phased approach focusing on the most impactful initiatives unfolding sequentially over the second through fourth quarters. In Q2, emphasis should be placed on stabilizing core processes and embedding foundational digital infrastructure improvements, particularly within manufacturing and mining operations. This phase is vital for establishing baseline data integrity and process automation capabilities, as these provide the scaffolding for subsequent enhancements in productivity and quality.
Moving to Q3, leadership should prioritize scaling automation and predictive analytics applications to optimize operational responsiveness and reduce downtime. Efforts should concentrate on consolidating supply chain diversification and streamlining procurement strategies, which have been identified as critical levers for margin recovery in inflationary environments. This quarter is also pivotal for accelerating workforce training programs aligned with new technology adoption to ensure functional sustainability and knowledge transfer.
By Q4, the focus transitions toward performance review, continuous improvement cycles, and embedding a culture of operational excellence via governance refinement and organizational realignment where necessary. This final phase should include assessment against midyear KPIs, recalibration of improvement roadmaps where shortfalls are detected, and reinforcement of best practices to secure run-rate profitability gains. Time-bound milestones include completion of automation rollouts, attainment of targeted margin improvements, and demonstrable progress on reducing operational costs by year-end.
Resource Allocation Strategy Across Sectors Within the 2026 Roadmap
Effective execution hinges on judicious resource allocation tailored to sector-specific dynamics and maturity levels. The industrial sector, grappling with margin pressures despite revenue growth, warrants the largest share of investment directed toward automation deployment, supply chain resilience, and capital expenditures designed to modernize production lines. Reports indicate planned capital outlays rising from approximately $140 million in 2025 to $175 million in 2026, signaling a commitment to scale these initiatives with an emphasis on digital and smart manufacturing solutions.
Conversely, the healthcare sector’s priority lies in sustaining pricing power amid regulatory and demographic challenges. Resource allocation here should be skewed toward technology-enabled service delivery improvements, advanced data analytics for care management, and personnel development aimed at enhancing patient engagement efficiency. Operational gains stem largely from refined cost controls and premium service differentiation rather than heavy capital expenditures.
Mining companies should prioritize investment in advanced operational monitoring systems and geopolitical risk mitigation mechanisms, balancing exploration spending with dividend sustainability. Technology deployments that enable remote operations and predictive maintenance deliver outsized returns given the commodity-driven earnings volatility. Strategic redeployment of capital from lower-return assets toward high-potential projects aligns well with disciplined cost management trends observed recently.
Ranking Top Five Operational Improvement Initiatives for Focused Sequencing
Prioritization is key to maximizing impact across a complex array of operational levers. The top improvement initiatives recommended for 2026 execution are: (1) deployment of autonomous, sensor-enabled manufacturing systems to boost efficiency and reduce manual variability; (2) expansion of supply chain diversification strategies to mitigate bottlenecks and price fluctuations; (3) implementation of advanced predictive maintenance to extend asset life and cut unplanned downtime; (4) scaling data integrity and analytics capabilities, enabling data-driven decision-making and performance transparency; and (5) workforce skill enhancement programs aligned with digital transformation objectives, ensuring effective adoption and sustained gains.
These initiatives are ranked based on a compound assessment of expected return on investment, time-to-impact, feasibility given current enterprise maturity, and alignment with broader strategic priorities. Notably, investment in autonomous smart operations has been consistently underscored as a transformative driver, capable of unlocking productivity benefits across manufacturing and mining enterprises, while healthcare’s priority lies in synthesizing analytics with patient engagement enhancements. This ranked framework enables executive teams to sequence initiatives pragmatically, balancing quick wins with longer-term systemic upgrades.
Building on this operational prioritization framework, the following subsection will pivot to integrating digital transformation strategies that underpin and accelerate the identified improvements, offering a comprehensive technology deployment plan essential for sustainable sector-level advancements.
Strategic Roadmap for Integrating Digital Transformation Across Industrial, Healthcare, and Mining Sectors
This subsection delineates a comprehensive strategy for embedding digital transformation initiatives into the core operations of the industrial, healthcare, and mining sectors. By examining cross-industry automation adoption, analytic frameworks, and talent development plans projected for 2026, it delivers actionable insights for executives aiming to harness technology-driven growth while navigating sector-specific challenges and workforce transitions.
Quantifying Automation Deployment: Sectoral Adoption Rates and Strategic Implications
The industrial sector continues to lead in absolute automation deployment, driven primarily by manufacturing and production process enhancements. Current estimates indicate that approximately 14-15% of industrial output value is influenced by robotics and autonomous systems adoption, with gains concentrated in energy, infrastructure, and manufacturing sub-industries. By 2030, this influence is projected to increase sharply as component costs decline and AI integration deepens, but industrial firms already plan 2026 automation expansions sufficient to raise efficiency and reduce supply chain vulnerabilities in the immediate term.
Meanwhile, mining operations are undergoing a rapid transformation, with a 2026 mining automation market size projected at over $5 billion and expected CAGR above 6.5% through the decade. Investments in self-driving vehicles, intelligent connected mines, and IoT-enabled remote operations are driving continuous productivity improvements and safety enhancements. This transition is crucial in offsetting labor scarcity and geopolitical risks, with mining automation poised to increase operational uptime through 24/7 workflows.
Healthcare automation adoption, while more measured relative to industrial and mining peers, is gaining momentum particularly in robotic surgery, diagnostics, and eldercare support systems. The integration of AI-powered clinical analytics and service robots addresses demographic pressures and cost containment goals. Planned deployments for 2026 emphasize augmenting human-machine collaboration rather than outright task replacement, reflecting the sector’s normative constraints and regulatory environment.
Collectively, these disparate adoption rates create both challenges and opportunities for cross-sector strategic alignment, with industrial and mining sectors focused on transformative efficiency gains, and healthcare emphasizing precision augmentation and patient experience improvements.
Architecting Analytics Platforms: Core Components for Q3 2026 Deployment
Across sectors, leading organizations are converging on standardized analytics architectures that integrate real-time data ingestion, AI-driven predictive models, and cloud-native scalability. Key components set for deployment by mid-2026 include advanced data lakes harmonizing structured and unstructured inputs, edge computing capabilities to support latency-sensitive operations, and modular AI pipelines enabling continuous learning and model retraining. These architectures underpin initiatives such as supply chain risk modeling in industrial firms, patient outcome optimization in healthcare, and mineral deposit analysis in mining.
Operationalizing these platforms requires robust cybersecurity frameworks and compliance mechanisms, especially in healthcare where patient data privacy is paramount. Integration with legacy systems remains a primary technical hurdle, with successful implementations involving phased migration strategies and API-driven interoperability layers. Moreover, investments in AI explainability tools are increasing to ensure governance and trust across decision-making processes.
The analytics frameworks are also being designed with extensibility to incorporate emerging data sources, including IoT sensors in mines, wearable health devices, and industrial equipment telematics. This adaptability supports near-real-time insights generation, a key differentiator in volatile commodity markets and dynamic healthcare environments.
Talent Development Investments in 2026: Building the Workforce for Digital Futures
Strategic workforce development is central to realizing digital transformation goals, with organizations across sectors intensifying investments in 2026 focusing on AI expertise, data science, and automation management. For example, national and corporate programs in advanced AI talent cultivation are deeply embedded, illustrated by multi-billion-dollar government-backed initiatives to train thousands of high-level AI specialists annually.
Internal talent mobility is a common approach, with firms actively upskilling existing employees possessing high data fluency to assume specialized AI and analytics roles. These measures are supplemented by partnerships with academic institutions and targeted external recruitment leveraging sophisticated assessment tools to optimize candidate fit and reduce hiring lag.
Retention programs are concurrently prioritized, recognizing the competitive environment for tech-skilled personnel. Incentive structures combining equity options, performance bonuses, and long-term career pathways are increasingly standard. In the industrial sector, automation-related technical skills development is accompanied by initiatives to cultivate change management capabilities to foster organizational adoption. Healthcare providers emphasize clinical AI literacy and data governance training, while mining companies focus on remote operation competencies and safety culture adaptation.
Forward-looking plans reflect a balanced emphasis on augmenting human skills through collaboration with intelligent systems, underpinning the critical role of hybrid workforce models in the near to medium term.
This strategic framework for digital transformation integration establishes the foundation upon which operational and financial gains in the 2026 fiscal year and beyond will be realized. The subsequent sections will explore how these technology and talent investments translate into sector-specific competitive advantages and inform portfolio allocation decisions.
Conclusion
The Q1 2026 earnings season vividly illustrates pronounced sectoral divergence, shaped by distinctive growth drivers and operational constraints. The industrial sector, while benefitting from solid revenue increases, continues to grapple with margin compression driven by inflationary cost pressures and persistent supply chain disruptions. In contrast, healthcare exhibits sustained pricing power and margin expansion, underpinned by premium service differentiation and effective cost management, as typified by UnitedHealth’s performance. Meanwhile, mining capitalizes on elevated commodity prices and operational discipline, generating record free cash flow and robust capital returns despite geopolitical uncertainties.
Cross-sector analysis highlights the critical role of digital transformation in modulating earnings resilience and operational efficiency. Healthcare’s advanced adoption rates support its margin expansion, industrial firms leverage automation for supply chain agility, and mining applies targeted digital tools to optimize capital-intensive operations. These technology deployments serve as vital enablers, mitigating sector-specific headwinds and underpinning sustainable growth trajectories.
Investor sentiment and analyst revisions reflect this complex environment: forward guidance accuracy varies across sectors, with healthcare facing elevated uncertainty due to regulatory changes, while industrials offer greater visibility. The interplay of earnings momentum, risk profiles, and governance quality informs prudent portfolio positioning, favoring a defensive overweight in healthcare, cautious industrial exposure, and selective mining investments calibrated for commodity cycles and geopolitical risk.
Looking ahead, strategic emphasis should be placed on sequencing operational excellence initiatives—prioritizing automation expansion, supply chain diversification, and advanced analytics deployment—tailored to sector-specific maturity and imperatives. Workforce development focused on digital skills and governance enhancements will further stabilize earnings and augment strategic agility.
In sum, Q1 2026 provides a data-driven foundation to navigate evolving economic realities with calibrated risks and opportunities. Sustained earnings growth will depend on adaptive pricing strategies, disciplined cost controls, and embracing technological innovation, enabling sectors and investors alike to capitalize on cyclical recoveries and structural market transformations through the balance of 2026 and beyond.
References
- What’s the earnings outlook for the first quarter of 2026?
- PDF MASTER-Air Liquide_Q1_2026_Presentation_EN
- Nike, Oracle, FedEx are part of Zacks Earnings Preview
- estimated - FactSet Earnings Insight
- The earnings bedrock - Standard Chartered
- Amazon, Alphabet, Microsoft, Meta and Apple are part of Zacks Earnings Preview - The Globe and Mail
- PDF UnitedHealth Group Reports 2025 Results and Issues 2026 Outlook
- Newmont Corp (NEM) Q1 2026 Earnings Call Highlights: Record Free Cash Flow and Strategic ...
- Freeport-McMoRan Inc (FCX) Q1 2026 Earnings Call Highlights: Record Copper Prices and Strategic ...
- Citi: Q1 2026 US Equity Earnings Outlook - Tech Sector Earnings Surprises Lead
- Universal Health Services' Q1 2026 Earnings: What to Expect
- Cerrado Gold Announces Q1 2026 Production Results at Its Minera Don Nicolas Mine in Argentina
- Global earnings resilience seen supporting equities despite stagflation concerns: Report
- Healthcare Sector Earnings & Financial Results | Most Recent Quarter
- First Majestic Reports Q1 2026 Production Results
- 4 Industrial Stocks Set to Outshine Q1 Earnings Estimates
- Wall Street loses momentum? 🚩 Highlights from the S&P 500 earnings season
- MOH Q1 EPS Tops Estimates on Lower Medical Costs, Membership Declines
- PDF UnitedHealth Group Reports First Quarter 2026 Results
- Key charts to help identify current sector trends
- Q1 2026 Earnings Season: Strategic Insights for Leaders - Coleman Management Advisors
- PDF Quarterly Sector and Investment Research Update | Q2 2026 | Fidelity ...
- PDF Chinese Mainland and Hong Kong IPO Markets: 2026 Q1 Review
- Foxconn Industrial Internet posts 102% net profit growth in 1Q26 on AI GPU, ASIC demand
- PDF GDP (Advance Estimate), 1st Quarter 2026
- Forget Geopolitics: Bet on Earnings Growth & Invest in These Sector ETFs
- Profits of China's major industrial firms expand by 15.5% in Q1, 2026, boosted by high-tech manufacturing: official data
- China's industrial profits rise in Q1 as high-tech manufacturing drives growth-Xinhua
- Equipment, high-tech manufacturing boost China's industrial profits-Xinhua
- Economic Watch: Equipment, high-tech manufacturing boost China's industrial profits-Xinhua
- PDF Microsoft Word - Earnings_Insight_080423.docx - Consello
- A Strong and Steadily Improving Earnings Picture
- Economic outlook: Second quarter 2026
- S&P 500 Energy and Utilities Sectors Earnings Previews: Q1 2026
- Q1 Earnings Season to Gain Momentum: What Will it Show?
- What Can Investors Expect from Bank Earnings?
- 1 in 4 S&P 500 Companies Can Now Prove AI Pays | PYMNTS.com
- PDF Readiness for AI adoption of Philippine business and industry: The ...
- Expert AI Agency | AI Marketing Agents Singapore - Hashmeta.ai
- PDF Innovations in Port and Shipping Management: Enhancing Operational Efficiency ...
- Enterprise Software Market Size & Industry Growth 2030
- PDF The Labor Market Impact of Digital Technologies
- China's manufacturing digital drive reaches mass adoption stage - CGTN
- Emerging Technologies Transforming Industries
- Advancing Armenia’s Economy Through Digital Innovation and Strategic Policies | International
- Digital Transformation Statistics and Facts 2024
- A Look At Southern Copper (SCCO) Valuation After Record Q1 Earnings And CEO Transition
- Aluminum Gains as Trump Vows to Maintain Naval Blockade on Iran
- Capstone Copper Corp (CSCCF) Q1 2026 Earnings Call Highlights: Record EBITDA and Strategic ...
- TECK Q1 2026 News Release
- TECK's Q1 Earnings Top Estimates on Record Copper Sales & Strong Pricing
- Imperial Reports Production Update for Red Chris Mine 2026 First Quarter
- PDF Presentation - teck.com
- Taseko Updates Florence Copper and Gibraltar First Quarter Production
- Second Quarterly Report - November 2025
- Earnings Resilience and Sectoral Divergence in 2026: Navigating Growth Dynamics Across Technology, Industrial, and Healthcare Sectors
- PDF The pass-through of cost shocks to firms' prices and the impact on ...
- PDF II. Inflation: a look under the hood
- Monthly Bulletin, December 2002 - European Central Bank
- PDF Investment decisions in a high-inflation environment
- Navigating Sectoral Divergence in 2026: Strategic Insights on Earnings Growth, Margin Dynamics, and Portfolio Positioning
- PDF Energy Price Shocks, Conflict Inflation, and Income Distribution in a ...
- Hormuz Disruptions: China’s Energy Security and Supply Chains
- Pricing Options & Tactics: How Game Theory Works 🎲
- AudioCodes Reports First Quarter 2026 Results
- Asia Optical 1Q26 revenue, profit hit record highs on AI cooling and optics growth
- PDF Ralph Lauren Reports First Quarter Fiscal 2026 Results Exceeding ...
- Teva Delivers Strong Q1 2026 Results Driven by Innovative Portfolio Growth and Disciplined Execution
- PDF Earnings call remarks - UnitedHealth Group
- UHG Earnings Q1 2026: Revenue, EPS & Key Takeaways
- [PDF] Teradyne Q4 and Full Year 2025 Earnings Call Prepared Remarks
- Q1 2026 Earnings and Federal Reserve Leadership Transition: A Multi-Sector Economic Analysis
- Q1 CY2026 Corporate Earnings Report: Mixed Growth and Profitability Trends Across Key Sectors
- Q1 2026 Corporate Earnings: Navigating Exceptional Growth Amid Geopolitical Uncertainty and Market Volatility
- Mixed Earnings Landscape Across Diverse Sectors: Key Corporate Results and Market Implications for Q1 2026
- PDF State of Pricing 2025 - simon-kucher.com
- Cost Control Beyond Budgeting: Business Management ...
- Silicon Laboratories Inc. (SLAB) Stock Forecast 2025 - AI Price Prediction & Investment Analysis | Intratio
- United Airlines makes big change to its bags policy
- Comprehensive Guide to Sector Analysis for Smarter Stock Selection
- CompX Q1 Earnings Grow 39% Y/Y on Marine Sales Growth
- Study of the impact of free zones and proposals for guidelines ...
- Income Distribution in the United States, By size, 1944 to ...
- PDF FDIC Quarterly Fourth Quarter 2014
- First Quarter 2026 - RBC
- 2006. "Economic Implications of Remittances and Migration"
- Urban Segregation and the Welfare State
- After Falling 25%, What's Next For Freeport?
- NYSE: FCX - Freeport-Mcmoran stock analysis and financials
- Bitdeer Reports Financial Results for the Full Year 2022 and Operational Update
- Copper Prices Are Plunging at Over 2% After Hitting Near 52-Week High
- Aecon reports first quarter 2026 results with record backlog of $10.9 billion
- Axsome Therapeutics Reports First Quarter 2026 Financial Results and Provides Business Update | Financial Post
- Q1 Results Announcement 2026
- News Release
- Baker Hughes Announces First-Quarter 2026 Results
- GE Aerospace 1Q 2026 10-Q
- [8-K] Knight-Swift Transportation Holdings Inc. Reports Material Event | KNX 8-K Filing
- WAL Q1 2026 Earnings Presentation
- PDF WFC.1Q.ER.04-14-26 EX99.1 - Release - Wells Fargo
- Top Manufacturing Trend for 2026: Autonomous, Smart Operations
- PDF Investors presentation Q3 2025 - cascades.com
- 2026 State of Data Integrity and AI Readiness
- Cathay Pacific redefines premium lounge experience with redesigned The Wing, First at HKIA
- The new shape of risk
- Financial Summary for FY2025 Performance Forecast for ...
- Oil And Gas Systems Integrator: Powerful Skid Solutions
- TOYOBO REPORT 2025
- From agentic AI to energy KPIs – the trends transforming telcos (Reader Forum)
- Lean Manufacturing and Process Improvement: The Complete Guide 2026
- PDF From territorial governance to the governance of public enterprises in ...
- Group Sustainability Disclosures Report 2024
- Overview of Reporting of ESG Metrics by the Upstream Oil ...
- THE ESG RISK RATINGS
- PDF Integrating ESG Metrics into Investment Valuation: A Quantitative and ...
- environmental, social and governance scores from refinitiv
- CIO Special
- Institutional Quality and Industrial Growth: A Causality ...
- PDF The impact of a scandal on a firm's E - EUR
- ESG > Sustainability > Investment & Value > Hyundai E&C
- Newmont (NEM) Is Down 10.0% After Authorizing US$6 Billion Buyback And Q1 Beat - Has The Bull Case Changed?
- Newmont beats quarterly profit estimates on strong gold prices
- Newmont Q1 Earnings Call Highlights
- NEM's Q1 Earnings and Sales Trounce Estimates on Higher Gold Prices
- Gold Faces Headwinds From Calmer Markets, Yet Newmont’s Record Cash Flow Tells Another Story
- Newmont Downgraded as Costs Surge: Is This Gold Giant Losing Its Shine at the Worst Possible Time?
- Here's Why Newmont Stock Is a Buy Before Its First-Quarter Earnings
- 2024 Annual Report to Security Holders - PNGX Markets
- 2024 Annual Report (10-K)
- Digital Transformation Market to Reach USD 5,641.90 Billion by 2033 as Technology Convergence and Sustainability Priorities Reshape the Sector with North America Holding 35% Share Led by Microsoft, IBM and SAP SE
- 2026 US Equity Outlook Great Potential
- AI and automation drive supply chain shift in 2026 report - MHD
- PDF National Bureau of Economic Research
- 2026 Business Leaders Outlook: Expectations & Trends
- Techmeme: Asus ROG Xbox Ally review: comfortable design, Xbox Full Screen beats Windows 11, and affordable, but sleep/wake issues, weak display, and average performance (Andrew E. Freedman/Tom's Hardware)
- AI Adoption in Manufacturing Reaches an Inflection Point in 2026, Finds New Analytics Insight Report
- AI Automation Statistics for Enterprises (2026): ROI, Adoption, Costs & Trends
- Artificial Intelligence Market Size & Demand Analysis by 2035
- Adopting and investing in AI: evidence from euro area firms in the SAFE
- UnitedHealth Group Incorporated (UNH) Beats Wall Street’s Q1 Revenue and Earnings Estimates
- UNH Q1 Deep Dive: AI Investment and Value-Based Care Drive UnitedHealth’s Strong Start
- UnitedHealth’s (NYSE:UNH) Q1 CY2026: Beats On Revenue, Stock Soars
- UnitedHealth raises 2026 profit outlook after Q1 earnings beat
- UnitedHealth profit edges up in Q1 2026
- UnitedHealth stock jumps 7% on earnings outlook beat
- UnitedHealth stock jumps 8% on earnings outlook beat
- Earnings live updates: UnitedHealth stock jumps on upbeat guidance, Tesla and others report this week
- UnitedHealth posts quarterly profit above Wall Street estimates, on track for turnaround
- The economic impact of robotics and autonomous systems ...
- Global Robotics Market Size, Share, Trends & Industry Forecast 2026-2034
- Mining Automation Market Size, Share | Industry Report [2034]
- Future of Jobs Report 2025
- MEASURING-DISTORTIONS-IN-INTERNATIONAL- ...
- PDF The Rise of AI Pricing: Trends, Driving Forces, and Implications for Firm Performance
- Linear Actuator Market to Surpass USD 66.96 Billion by 2032 | Report by SNS Insider
- Factory Automation Market Size 2024: Global Share, Industry And Report Analysis By 2031 | WIKA Instruments India Pvt. Ltd. Yokogawa Electric Corp.
- Industrial Automation And Control Systems Market Report 2024 - Automation Systems Market Insights
- Free Earnings Calendar 2026 - Stock Earnings Dates | Pineify
- HYBE Co., Ltd.: Fundamental Analysis and Financial Ratings | A352820 | KR7352820005 | MarketScreener
- Sandisk Corporation: Fundamental Analysis and Financial Ratings | SNDK | US80004C2008 | MarketScreener
- Sanil Electric Co., Ltd.: Fundamental Analysis and Financial Ratings | A062040 | KR7062040001 | MarketScreener
- Fastenal Company: Fundamental Analysis and Financial Ratings | FAST | US3119001044 | MarketScreener
- What You Need to Know About Cintas Corporation's Q4 Earnings
- KoMiCo Ltd.: Fundamental Analysis and Financial Ratings | A183300 | KR7183300003 | MarketScreener
- Hanwha Aerospace Co., Ltd.: Fundamental Analysis and Financial Ratings | A012450 | KR7012450003 | MarketScreener
- Hyundai G.F. Holdings Co., Ltd.: Fundamental Analysis and Financial Ratings | A005440 | KR7005440003 | MarketScreener
- DL E&C Co.,Ltd.: Fundamental Analysis and Financial Ratings | A375500 | KR7375500006 | MarketScreener
- Tanger Q1 2026 slides: portfolio growth accelerates amid challenges By Investing.com
- What's the Buzz Around Q1 2026 GDP and Why Does it Matter
- Molina Healthcare, Inc. Q1 2026 Earnings Analysis - HealthWorksAI
- Intuitive Surgical, Inc. Q1 2026 Earnings Call Summary
- TSMC Q1 2026 Revenue: 5.71B Earnings Beat and 6B Capex
- UL Solutions Inc. R (72R.DU) Q4 FY2025 earnings call transcript
- Samsung E&A (028050.KS) Deep Dive: Investment Thesis & Fair Value Analysis
- [PDF] Equinix Provides Robust 2026 Outlook Driven by Strong Fourth
- Petco Reports Fourth Quarter and Full Year 2025 Results
- Five Star (FSBC) Q1 2026 Earnings Transcript
- Exhibit 99.1 Earnings Release 04.23.2026
- Newmont tops Q1 estimates as record cash flow drives buyback boost
- Financial Institutions, Inc. Reports Net Income Available to Common Shareholders of $20.6 million, or $1.04 per Diluted Share, for the First Quarter of 2026
- Newmont (NEM) Is Down 5.8% After Inflation-Driven Gold Weakness Tests Its Cash Return Outlook
- PDF Earnings Results Presentation First Quarter 2026
- Catering International & Services: Business Model Canvas
- LG Household & Health Care SWOT Analysis
- PDF Investor Presentation Q1'
- Q1 2026 Round Up: Proceed… With Caution
- Industrial Cable Supply Chain Resilience: Economics of Import Substitution and Technical Equivalent Procurement
- Effect of Supplier Relationship Management on the Supply ...
- Logistics Network Optimization: Strategies + Software (2026) | Sophus Technology Inc
- The Transformative Impact of the Chief Procurement Officer on Business Strategy | ProcureWise
- PDF The Business Cycle Approach to Equity Sector Investing
- PDF Presentation - mebfaber.com
- PDF Strategic Sector Selector Trav & Leis Implied dividend growth ... - Invesco
- Sector Analysis: How Industry Trends Impact Company Performance | Wealthsimple
- Rising geopolitical tensions are beginning to weigh on ...
- Consumer Staples Earnings Tracker Excel: Q1 2026 Inflation Watchlist (2026) | MarketXLS
- Key charts to help identify current sector trends
- Rebalancing portfolios for a more sustainable cycle | Barclays Private Bank
- A Multi-Asset Playbook for Geopolitical Shocks and Oil Supply Disruption | MSCI
- PDF JHL - cdn.prod.website-files.com
- PDF ESG-Integrated machine learning portfolio opimization strategies ...
- PDF What Triggers Stock Market Jumps? - Harvard Business School
- 2026 CLA Economic and Market Outlook for Investors and Businesses
- Corporate Finance and Environmental, Social, and ...
- Institutional Investors and ESG Preferences
- PDF The Role of Corporate Governance in Stock Market Valuation
- PDF Exploring the Relationship Between Corporate Governance and Stock ...
- Gold miner lifted quarterly dividend 60% after $101.7M free cash flow
- Endeavour Mining Q1 2026 gold output falls to 282,000oz
- Does G Mining Ventures (TSX:GMIN) 2026 Guidance Reaffirm Its Long-Term Mine Plan Credibility?
- Hochschild Mining Posts Q1 Output of 76K Gold-Equivalent Ounces, Reaffirms 2026 Guidance
- Thor Explorations Announces Q1 2026 Operating Update
- Reports Q1-2026 Production & Operational Highlights
- Golconda Gold Releases Q1 2026 Production Update and Announces Record Quarterly Production at the Galaxy Gold Mine
- Minera Alamos Reports First Quarter 2026 Gold Production of 8,734 Ounces; Cash Balance Increased to $46 Million
- Lundin Gold Reports Q1 2026 Production of 119,742 Ounces of Gold
- HSBC Venture Healthcare Report: 2026 Q1
- PDF 2026 Healthcare Outlook - pitchbook.brightspotcdn.com
- PDF Q1 2026 Announcement - GSK
- PDF Q1 2026 Biopharma Licensing and Venture Report - J.P. Morgan
- Hospital Marketing ROI Measurement & Campaign Playbook (2026)
- Global Digital Health Ecosystem Q1 2026 Performance Review - Galen Growth
- PDF Cost Reduction Techniques and Supply Chain Issues in the United States ...
- PDF Quantifying Supply Chain Disruption: A Recovery Time Equivalent Value ...
- PDF Global supply chain disruptions: evolution, impact, outlook
- PDF Developing a framework for supply chain resilience in renewable energy operations
- PDF Ijrti - Ijcrt
- How to Complete a Bottleneck Analysis in 5 Steps
- Manufacturing Planner’s Guide: Bottleneck Analysis
- PDF An Investigation of Airline Catering Supply Chain Processes ...
- 2021–2024 four-year review - of supply chains for the energy ...
- 13 Supply Chain Manager Resume Examples for 2024
- Budget Activity 5C - Justification Book - U.S. Army
- PDF Artificial Intelligence Strategic Plan, January 2026 Update
- Don't Overlook Workforce Development in Your 2026 Budget
- PDF ANNUAL REPORT 2025 - hkexnews.hk
- South Korea invests 1.4 trillion won in AI talent development | British Council
- Investor Presentation
- Investor Meeting 1H FY3/2026
- Singapore grows local AI talent pool with S$1b investment plan
- New 109.2 Billion Won Program to Attract Young Overseas Talent to Korea — Paperslip
- PDF Emerging Risk I: Edge AI Application Scaling hallenges
- Navigating Earnings Momentum: Strategic Insights from Q1 2026 Corporate Performance and Sectoral Divergence
- PDF Q2 2025 Global Markets Compass - CIBC
- 2026 Year-Ahead Outlook
- Q1 2026 Earnings Insights: Divergent Sector Dynamics Amid Geopolitical Turbulence and Market Rotation
- Resilient Growth Amidst Fragmented Signals: A Strategic Analysis of Q1 2026 Corporate Earnings and Sectoral Divergence
- PDF Pro Report-V01 - files-scs.pstatic.net
- Q1 2026 Corporate Earnings: A Strategic Analysis of Resilience, Sectoral Leadership, and Margin Durability
- Outlook for FY25–26 corporate earnings
- Wall Street loses momentum? 🚩 Highlights from the S&P 500 earnings season
- Nvidia's Stock Has Driven the S&P 500 Higher. Here Are Some Reasons Why Its Influence Might Decline.
- Expectations and realities: 12 predictions for the year ahead in energy
- 2 Canadian Stocks You Can Buy Today and Hold for 5 Years | The Motley Fool Canada
- BC exploration spending hits record $751M in 2025 as copper overtakes gold
- Mayo Lake Plans 2,000 Metre Drill Program on RIRGS
- Global Critical Minerals Outlook 2025 - NET
- PDAC 2025: Investment Capital, AI Energy Demand and the Race for Resources
- World Economic Situation and Prospects 2025
- Southeast Asia Energy Outlook 2024 - NET
- How Investors Are Reacting To UnitedHealth Group (UNH) Earnings Beat, Guidance Hike and Governance Challenge
- Q1 2026 Corporate Earnings: Sectoral Divergence and AI-Driven Productivity Amid Global Uncertainties
- PDF Costs of Caring - American Hospital Association
- AI-Driven Transformation and Sectoral Dynamics: A Comprehensive Analysis of Q1 2026 Financial Performance and Strategic Outlook
- Publix reports first quarter 2026 results and stock price
- Q1 2026 Earnings Deep Dive: AI-Driven Tech Supremacy, Pharma Challenges, and Automotive Transformation
- New Medicare payment rules hit MIMEDX wound sales 60%, cut 2026 view
- Patient Opportunity Equity Strategy Remains Firm on Its Thesis for UnitedHealth Group (UNH)
- PDF First Quarter 2026
- UnitedHealth (UNH) Sets Sights on Market Comeback After Brutal Quarter
- PDF Q1 Fiscal 2026 Earnings Presentation - Rockwell Automation
- Q1 2026 revenues
- Q1 2026 revenue
- PDF Q1 2026
- Teva Delivers Strong Q1 2026 Results Driven by Innovative Portfolio Growth and Disciplined Execution
- 8-K Material Event Wed Apr 29 2026
- A gradual start to FY 2026, with fundamentals moving in the right direction. Full-year targets confirmed with organic growth range narrowed. – Company Announcement - FT.com
- Halliburton announces first quarter 2026 results
- A gradual start to FY 2026, with fundamentals moving in the right direction. Full-year targets confirmed with organic growth range narrowed.
- PBR AI Stock Analysis and Valuation 2025-10-08
- European Dividend Stocks To Watch
- Net Asset Value update – Q1 2026
- PDF Cytonn Q1'2026 Markets Review Executive Summary: Global Markets Review ...
- Apple Inc. (AAPL) down 0.2% in 2026 $271.06 - buy sell signal
- Income Investors Can Rely on Ford’s Dividend: Here’s Why the Payout Is Secure
- Deutsche Bank Faces Barclays Downgrade As Dividend And Profit Signal Tension
- PDF ANNUAL REPORT - relais.fi
- AI Models Turn More Cautious on Polaris (PII) as Earnings Pressure Mounts - TipRanks.com
- Analysis of Coca-Cola's Dividend Performance and Sustainability
- Stock Market Sectors Guide: 11 GICS Sectors Explained
- PDF Choosing Sectors Over Style - WestEnd Advisors, LLC
- PDF Discovering the signs of Dutch disease in Russia
- PDF 2025 China Stock Market Forecast Analysis and Strategy Suggestions Based on Huangji ...
- PDF Saudi Arabia's Potential to Enhance its Position as a Key Goods ...
- PDF Dividend Dynamics: Sector Perspectives - Ameriprise Financial
- Breakthrough innovation and growth | PwC UK
- Top 5 Sectors to Invest in 2025
- Limit Switch Market to Experience Steady Growth at 6.1% CAGR, Reaching New Heights by 2032 - Persistence Market Research
- Top 5 Sectors To Invest In 2024
- Insperity (NSP) Q1 2026 Earnings Transcript
- Fulgent Genetics, Inc. Q1 2026 Earnings Call Summary
- INVESTOR PRESENTATION
- Q1 2026 EARNINGS RELEASE CALL
- PDF Eurofins Q3 2025 Results Presentation
- Moody's Corporation Q1 2026 Earnings Call Summary
- QSE listed companies record QR12.763bn net profit in first quarter | The Peninsula Qatar
- Wearable AI Market Size, Share & Trends | Forecast [2034]
- PDF THIS REPORT IS STRICTLY FOR INTERNAL CIRCULATION ONLY* Budget 2026 Review
- Q1 2026 Semiconductor Demand Surge & Lead Time Outlook
- Calm Q4 earnings may hide storm from war-led costs
- Service Robotics Market Size, Share, Industry Report 2034
- Floriculture Market Size, Share, Industry Analysis,2026–2034
- Algeria Food Fibers Market Size, Share & Growth Report
- Sensex today | Stock Market Live Updates: Benchmarks hold gains, Sensex up 325 points as volatility persists
- Sensex today | Stock Market Highlights: Benchmark indices close firmer; Sensex settles 355 points higher at 77,269, Nifty up 121 points at 24,119
- monthly bulletin march 2005 - European Central Bank
- Sector vs. Industry Weighting Explained
- PDF A Study On The Impact Of Selected Macro-Economic Variables On Indian ...
- Econometric Forecasting Using Ubiquitous News Text
- Sensex prediction: Sensex @ 95,000 in 9 months? Morgan Stanley's Ridham Desai says bull market coming - The Economic Times
- PDF Quantile-based assessment of investor sentiment, uncertainty and ...
- USD/INR Exchange Rate Surges as Soaring Oil Prices Crush Indian Rupee | Forex News Financial Markets | CryptoRank.io
- [PDF] Does investor sentiment affect the Indian stock market? Evidence ...
- EXTENSIONS OF REMARKS
- PDF Political risk and corporate performance: mapping impact
- Mongolian Mining Sector Update: Regulatory Uncertainty and Risk Mitigation Strategies
- Tanzania: Training Highlights Safety Gaps and Cost Burdens in Mining - allAfrica.com
- Assess Lithium Mine Supply Chain Risk from Raw Material Volatility
- Iran Conflict Energy Price Surge: Global Impact
- PDF An integrated management strategy for acid mine drainage control of sulfidic tailings
- PDF Risk Management in Oil & Gas: Ensuring Operational Resilience
- ESG-CLIMAT REPORT
- Mitigation strategies for mining companies navigating economic and political risk uncertainty | Marsh
- Base Oil Prices 2026: Trends, Forecast & Price Index
- Mixed Q1 2026 Earnings Reveal Divergent Sector Strengths Amid Global Uncertainty: Technology Innovation vs. Industrial Resilience
- Procept (PRCT) Q1 2026 Earnings Transcript
- Electrolux AB (ELRXF) Q1 2026 Earnings Call Highlights: Navigating Challenges with Strategic ...
- Genuine Parts Company Q1 2026 Earnings Call Summary
- How Much Does the H100 GPU Cost in 2026?
- South Korea Home Healthcare Market Size & Forecast to 2033
- PDF Promoting healthy aging: A review of community-based interventions to ...
- UnitedHealth (UNH) Q1 2026 Earnings Transcript | The Motley Fool
- Elderly Care Market Size, Share & Trends | Growth Report [2034]
- 9 Employee Benefits Trends for 2026
- Latest Trends in the Healthcare Industry To Watch In 2025
- Medical Accompaniment Service Market Forecast, 2026-2033
- Annual Report 2018
- PDF Demographic shifts and healthcare: A review of aging populations and ...
- Current Radiologist Shortage Projected to Persist to 2055 - Drugs.com MedNews
- Fund Call | Calm capital compounding
- Q1 2026 Earnings Momentum: Technology and Financial Services Powering Sustained Market Outperformance Amid Sectoral Divergence
- Fund Call | Balancing risk and return
- Capital Market Outlook
- Global Investment Outlook
- How to invest Rs 10 lakh in 2026: 5 top Fund Managers reveal the Ultimate ‘Model Portfolio’
- Portfolio Management Guide 2026 | Build & Optimize Your Investment Portfolio
- Altrius Global Dividend Income Strategy