Designing and Creating Business Reports with Microsoft Access and Tekla PowerFab
A Practical Guide to Crafting Custom and Standard Reports for Business Insights
Table of Contents
Introduction
This guide is designed to equip professionals with a clear, practical methodology for creating diverse business reports tailored to organizational needs using Microsoft Access and Tekla PowerFab. It targets report designers, business analysts, and IT practitioners who seek to enhance their reporting capabilities by leveraging these powerful tools effectively.
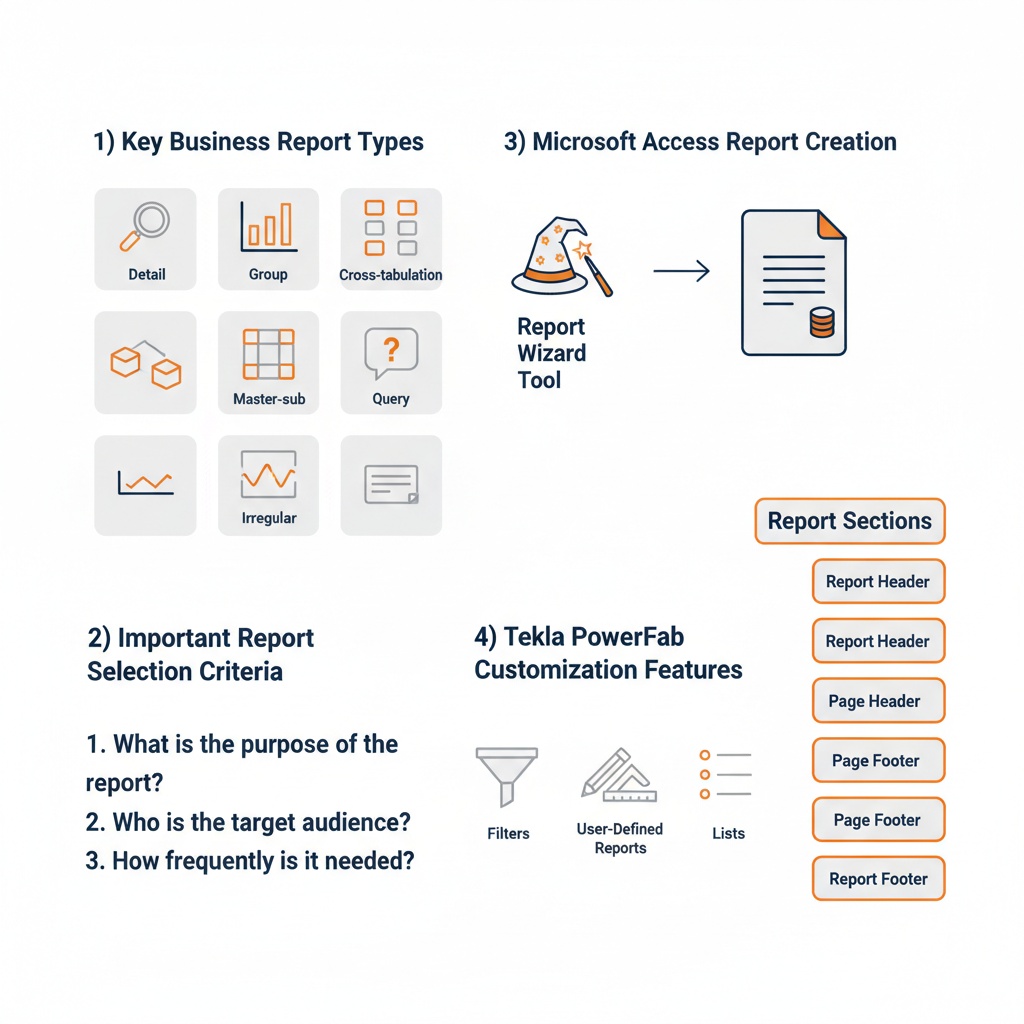
Infographic Image: Optimizing Business Reporting: Types, Tools, and Customization
The document outlines foundational concepts around business report types, enabling readers to understand the purpose and selection criteria behind each report format before progressing to hands-on instructions. Readers will then learn how to build and customize reports within Microsoft Access, including record source selection, report wizard usage, and report element configuration.
Further, the guide explores Tekla PowerFab’s advanced reporting customization capabilities, focusing on user-specific report list management, applying filters, and creating user-defined reports. Structured for step-by-step progression, this resource supports readers at intermediate technical proficiency to confidently design and manage business reports that deliver actionable insights.
1. Understanding Business Report Types and Their Purposes
In the contemporary business environment, the ability to select and utilize the appropriate type of report is foundational to transforming raw data into actionable insights. Reports are not mere repositories of information; they serve as critical tools for decision-making, performance evaluation, and strategic planning. Establishing a clear conceptual understanding of various business report types lays the groundwork for developing effective reporting solutions that meet organizational needs. This conceptual framework ensures that the subsequent technical steps in report creation are aligned with the intended business objectives, enhancing the relevance and impact of the reports generated.
Building on the strategic narrative introduced earlier, where the focus is on tailoring business reports to organizational requirements, it becomes essential to first clarify what these report types are and why the correct classification matters. Different report types cater to diverse business goals—from transactional tracking to multidimensional analysis—and choosing one over another directly influences how information is interpreted by users. As businesses increasingly rely on data-driven decisions, mastering this foundational knowledge is indispensable, ensuring that report designers deliberately select formats that optimize clarity, usability, and insight.
This section delves into the core realm of business report taxonomy, elucidating the characteristics, purposes, and applications of key report types in business environments. Beyond listing these types, it offers criteria that help guide the decision-making process in selecting an appropriate report style for given business scenarios. Through practical examples, it illustrates how these different reports serve varied analytical functions such as detailed operational reviews, summarized performance tracking, or interactive data exploration, thereby equipping readers with the ability to discern and apply the most fitting reporting approach for their unique analytical challenges.
Key Business Report Types: Definitions and Roles
Business reports come in a variety of forms, each designed to serve specific purposes and cater to distinct business needs. Among the most common are detail reports, group reports, cross-tabulation (cross) reports, master-sub reports, irregular reports, and query reports. Detail reports provide straightforward tabular listings of data—such as sales transactions, customer inventories, or expense records—offering granular visibility into day-to-day operations. Their primary value lies in the clarity and completeness of data presentation, supporting thorough audits, reconciliations, and operational tracking.
Group reports, by contrast, introduce hierarchical organization by aggregating data based on common attributes. For example, a group report might summarize sales volume by region or supplier, enabling management to identify patterns, compare performance across categories, and focus on higher-level trends rather than individual records. Cross reports extend this concept by dynamically structuring data in multi-dimensional tables where row and column headings represent different data fields, facilitating rapid comparative analysis across two variables simultaneously. Such reports are particularly useful in financial analysis or product performance reviews, where contextual relationships matter.
More complex are master-sub reports, which combine summary information with linked detailed subsets, often allowing interactive drill-downs to reveal underlying data. This format supports layered analysis and is frequently employed in executive dashboards and operational reporting where users transition seamlessly from overview to specifics. Irregular reports tackle the challenge of non-uniform data presentations, accommodating inconsistent formats such as invoices, bills of materials, or customized billing statements. These emphasize layout flexibility without compromising data integrity. Lastly, query reports incorporate specifying criteria or filters—such as date ranges or product categories—to extract targeted subsets of data, essential for time-sensitive or conditional reporting needs.
Criteria for Selecting Appropriate Report Types
The selection of a suitable report type is not arbitrary but should be guided by clear business goals, the nature of the data, and the intended audience. A critical criterion is the depth of detail required: if operational teams need to inspect every transaction or record, detail reports serve best, providing exhaustive data lists. Conversely, when the objective is to monitor performance or aggregate results across dimensions such as geography or product lines, group or cross reports better reveal summarized trends, enabling efficient decision-making without overwhelming users with data minutiae.
User interactivity and data volume are other considerations. For large datasets with varying analytical queries, query reports allow users to filter and retrieve relevant information on demand, maintaining report responsiveness and focus. Furthermore, reports serving as management dashboards or requiring hierarchical insights benefit from master-sub reports, which offer layered views suitable for executives requiring both overview and drill-down capabilities.
Print formatting and layout complexity may also drive report type choice. Operational documents requiring fixed positioning, such as invoices or labels, mandate irregular or split reports that conform to strict visual standards. Additionally, report accessibility across platforms and devices influences format selection—interactive query or dashboard-style reports may be favored for dynamic online use, while detail or group reports might be optimized for printable summaries.
In summary, the appropriateness of a report type hinges on answering three key questions: What decisions will the report inform? Who will use the report, and how will they consume it? What specific data structures and volumes are involved? Addressing these questions ensures alignment between report design and business imperatives, ultimately generating meaningful insights rather than mere data output.
Business Applications and Examples of Report Types
To ground the theoretical overview in practical reality, consider common business scenarios exemplifying how different report types apply effectively. In retail sales management, detail reports document every transaction, supporting inventory adjustments and transaction validations. Concurrently, group reports aggregate sales by region or product category, shedding light on profitable areas and informing marketing focus.
Financial departments often rely on cross reports to monitor budget expenditures across departments and time periods, enabling side-by-side column and row comparisons of costs, revenues, and variances. The dynamic nature of cross reports aids in uncovering patterns not immediately visible in linear data presentations. For executive leadership, master-sub reports function as interactive summaries where a high-level sales performance overview can be drilled down to individual regional manager results or key accounts, facilitating layered strategic discussions.
Irregular reports find their place in logistics or manufacturing environments where shipment labels, packing lists, or parts orders require precisely formatted templates with consistent data placement despite varied content lengths. Query reports become indispensable in compliance or audit functions, where authorized users dynamically select specific date ranges or transaction types for on-demand reporting, maximizing operational agility and responsiveness.
Ultimately, these examples reflect a broader truth: the strategic use of report types enhances the informational ecosystem of an organization. Designing reports with a purposeful match to business process demands not only improves clarity but also maximizes the analytic value extracted from corporate data repositories.
2. Creating and Designing Business Reports in Microsoft Access
Translating the theoretical understanding of business report types into tangible, actionable outputs is a critical phase in transforming data into strategic insights. Microsoft Access, with its versatile report creation capabilities, stands out as a powerful tool to realize diverse reporting needs. Building directly upon the conceptual foundation of selecting appropriate report types, this section delves into the practical methodologies and step-by-step procedures for crafting reports tailored to specific business purposes within Access. The approach not only consolidates data from various sources but also enables fine-grained customization empowering users to present data with clarity and precision suited for organizational analysis and decision making.
The strength of Microsoft Access lies in its ability to integrate data sources seamlessly and offer guided report generation via intuitive tools like the Report Wizard. This facilitates the construction of both straightforward lists and elaborate, grouped reports without requiring extensive programming knowledge. Furthermore, Access’s design environment allows extensive customization including dynamic grouping, sorting, and intricate header and footer configurations, enabling reports that are both aesthetically professional and functionally robust. By focusing on these capabilities, users gain the skills to develop reports that reflect their organizational logic and reporting standards with high fidelity.
In today’s data-driven environment where rapid, accurate reporting underpins competitive advantage, mastering Access’s technical features for report creation is indispensable. This section elevates the reader’s proficiency from theoretical report type selection into concrete actions that result in fully functional Microsoft Access reports. By emphasizing practical workflows and design elements, it prepares users not only to generate reports but also to adjust and enhance their layouts for optimal communication of business insights. This sets the stage for further advancement into customized user-specific reporting environments, as later explored through Tekla PowerFab’s specialized functionalities.
Choosing and Linking Record Sources
At the core of any Microsoft Access report is the record source—the underlying data set from which the report draws its content. Selecting an appropriate record source is the foundational step that shapes the accuracy and relevance of the final report. Access permits record sources to be tables, queries, or a combination thereof. When all desired report fields reside within a single table, that table can be directly used as the source, simplifying report building. However, real-world business data is often normalized and partitioned across multiple tables, necessitating the creation of queries that join related tables to consolidate meaningful information.
An effective strategy involves carefully analyzing the data fields required for the report against the underlying database schema, then either identifying existing queries or designing new ones tailored specifically for the reporting context. For instance, a sales performance report might require combining customer details from one table with transaction records from another. Developing the right queries ensures that the report’s record source contains all necessary data in an optimized, accessible format. Linking these record sources correctly also influences report performance; well-designed queries minimize redundant data retrieval and speed up report generation.
Microsoft Access offers tools to facilitate this linking, including the Query Design interface, where relationships and join types (inner, outer, etc.) are visually defined to aggregate data logically. Users should ensure that relationships are structured to reflect the intended business logic—for example, joining products sold to sales transactions via product IDs. This upfront diligence in selecting and linking record sources guarantees that subsequent report creation and customization work on a solid, coherent data foundation, directly influencing report accuracy, usability, and ultimately business decision quality.
Using the Report Wizard for Report Creation
After establishing the appropriate record source, Microsoft Access provides the Report Wizard—a guided tool that streamlines the report creation process through an interactive interface. The Report Wizard enables users to selectively specify which fields to include, how to group and sort data, and the overall structure of the report, all without manual code or advanced design skills. This method is particularly valuable for new Access users or those tasked with quickly generating professional-standard reports from complex datasets.
The wizard workflow begins with field selection from one or multiple tables or queries, allowing aggregation of cross-table data. Importantly, if fields come from multiple sources, the user can iteratively add these without prematurely concluding the selection process. Once fields are chosen, the wizard prompts the user to define grouping levels—such as summarizing sales by region or by product category—integral for transforming raw data into meaningful insights. Sorting criteria are also set at this stage, enabling ascending or descending order presentation on key fields, which enhances report readability and analytic value.
Finally, the Report Wizard offers layout options, ranging from tabular lists to justified or stepped layouts, and predefined styles that control visual appearance. Upon completion, Access generates a preview of the report, reflecting all chosen parameters. This output can then be further modified in design or layout views for refinement. Utilization of the Report Wizard thus accelerates the development cycle, reduces errors associated with manual report construction, and encourages consistent report formatting across organizational reports.
Customizing Report Elements: Headers, Footers, Groups, and Sorting
Beyond initial creation, the power of Microsoft Access reporting becomes evident through the ability to customize various report elements that enhance clarity, branding, and navigation. Understanding and manipulating sections—such as report headers, page headers, group headers and footers, detail sections, and page footers—are essential for producing reports that are not just data containers but well-structured documents conveying hierarchy and context.
The report header, printed once at the beginning, serves as the cover page equivalent within the report, where organizational logos, report titles, and date stamps can be embedded to instill professionalism and recognition. Page headers provide continuity by repeating key information such as report names or subtitle fields consistently across all pages. Group headers and footers are especially important when reports are organized into categories; they can hold labels indicating the current group (e.g., product category name) and aggregate computations such as group sums or averages, respectively. For example, in a sales report grouped by region, the group header would identify the region, while the group footer might display total sales for that region.
Sorting within reports is configured by defining the order of records based on one or multiple fields, which directly impacts the interpretability and logical flow of the information displayed. Access’s grouping and sorting dialog permits hierarchical configuration, enabling nested grouping structures that reflect complex business relationships, such as sales by region, then by sales representative. Additionally, the use of calculated controls—fields derived from expressions—can be integrated within these sections to provide dynamic computations like discounted prices or growth percentages. Through these customization features, reports become tailored communication tools, capable of delivering nuanced business messages beyond raw data presentation.
Finally, these design adaptations are made using Access’s Design and Layout views, which provide visual interfaces to drag, add, or rearrange report controls. Controls may include bound text boxes linked to data fields, labels, images, or lines that enhance readability. Mastery of these elements empowers report designers to translate business logic and aesthetic considerations effectively, crafting outputs that align with corporate reporting standards and stakeholder expectations.
3. Customizing Report Lists and Advanced Reporting with Tekla PowerFab
Tekla PowerFab’s report list customization capabilities represent a transformative advancement in how organizations manage and deploy their reporting assets. By centering the experience on user-specific needs and roles, PowerFab fosters an environment where report accessibility aligns directly with operational priorities and individual responsibilities. This synergy between flexibility and user-centric design paves the way for more insightful, timely business analysis and supports continuous improvement in project delivery and resource management.
Moving beyond basic report creation workflows, these customization features enable organizations to scale reporting complexity without sacrificing usability. They bridge the gap between data generation and actionable insight, ushering in a new standard for advanced reporting management. As a natural extension of the structured report design introduced earlier, Tekla PowerFab’s approach underscores a strategic shift towards empowering end-users through personalized reporting landscapes, completing the technical narrative before advancing to the guide’s concluding synthesis.
Accessing and Modifying Report Lists in Tekla PowerFab
Navigating to the report management interface within Tekla PowerFab is intuitive and designed to integrate seamlessly with daily workflows. Users begin by opening any job within a PowerFab module and accessing the associated ribbon tab. From there, selecting the Reports option or pressing Ctrl+R invokes the Report Filters dialog, which serves as the entry point for tailored report selection. This dialog facilitates initial filtering by report type, enabling users to narrow down available reports in alignment with their current analytical focus or project phase.
Modifications to report lists occur within the Report Types dialog, which can be accessed from the Report Selection or Report Progress interfaces by clicking the Edit Report Types option. Here, users can create new report lists by clicking the New button and providing descriptive identifiers, such as a user’s name or function, fostering easy recognition and management. The dialog's dual-pane structure displays all available reports on the left and the selected reports included in the custom list on the right, allowing users to curate precisely which reports are accessible within their workspace.
Fine-tuning of report lists extends beyond simple inclusion or exclusion; users have granular control over each report’s presentation and behavior. Options to change the displayed report name or the report title—the latter appearing atop the report output—enhance clarity and alignment with business terminology. Ordering reports via Move Up or Move Down controls ensures logical sequencing based on frequency of use or priority. Furthermore, print defaults such as the number of copies and printer selection can be pre-configured, optimizing operational readiness for recurring report distribution.
Applying Filters and Selecting Specific Report Types
Effective filtering within Tekla PowerFab serves as a powerful mechanism to distill vast report collections into focused subsets tailored to specific user needs or job requirements. Upon entering the Report Filters dialog, users utilize the Type list to select report categories pertinent to their current tasks, such as material reports, labor tracking, or cost analyses. Selecting a filter type prompts the Filter dialog, where users explicitly indicate which items—whether report components, date ranges, or metric parameters—to include in the report generation process. This targeted filtering ensures reports generated produce relevant, actionable data without superfluous content.
Tekla PowerFab offers flexible filtering controls depending on the selected filter type. For list-based filters, arrow buttons allow users to move desired items into an Included list, enforcing an explicit selection methodology that prevents ambiguity in report content. For quantitative filters, users specify minimum and maximum values, enabling refined data range definitions that sharpen analytical focus. This bifurcated filtering design balances ease-of-use with powerful precision, catering to both novice users and advanced analysts.
By applying these filters prior to report generation, users effectively tailor the report content to their immediate informational goals, reducing the effort and time traditionally expended in manual post-processing or irrelevant data exclusion. This filtering process, combined with the customizable report lists, nurtures a reporting environment that is both flexible and user-friendly, reinforcing Tekla PowerFab’s commitment to operational efficiency through intelligent report management.
Creating User-Defined Reports and Assigning Them Appropriately
Beyond customizing pre-existing report lists, Tekla PowerFab empowers users and administrators to design and implement user-defined reports tailored specifically to organizational needs or niche analytic requirements. User-defined reports augment the reporting ecosystem by facilitating bespoke data presentations that may not be satisfied by standard reports, thereby increasing the scope of business intelligence capabilities within the PowerFab environment.
Creating a user-defined report typically begins with identifying gaps or specialized data queries that standard reports do not cover. PowerFab provides mechanisms to define the parameters, layout, and output specifications of these custom reports. Once created, these reports can be seamlessly added to existing report lists or designated into newly created lists, making them accessible alongside standard reports within the user interface.
Assignment of user-defined reports is pivotal for maintaining structured access and ensuring relevance to company roles and responsibilities. Administrators can associate these reports with specific modules or user profiles, guaranteeing that the right personnel have timely access without cluttering their report landscape with extraneous options. This targeted deployment not only increases adoption and usability but also enhances data security by restricting sensitive reports to authorized users.
Furthermore, Tekla PowerFab supports dynamic management of user-defined reports, including renaming, repositioning within lists, default print settings, and printer selections, mirroring the customization scope available for standard reports. This consistency streamlines the administrative burden and empowers users with a cohesive, predictable interface, encouraging broader use of advanced reporting functionalities.
Conclusion
In summary, mastering the creation and customization of business reports through Microsoft Access and Tekla PowerFab empowers organizations to transform raw data into meaningful insights aligned with varied operational and strategic needs. By understanding report types and applying the precise tool functionalities demonstrated, readers can develop tailored reporting solutions that enhance decision-making and communication.
The processes described promote not only effective report design and generation but also ongoing flexibility through customizable report lists and user-defined reports, ensuring reporting environments remain relevant across diverse user roles and evolving business contexts. Readers are encouraged to explore additional resources on advanced data analysis and reporting best practices to further refine their skills.
Moving forward, practitioners can build upon the foundational knowledge and technical procedures herein, integrating these reporting tools more deeply into their workflows to support sustained business intelligence excellence and operational efficiency.
Glossary
- Detail Report: A type of business report that provides a straightforward tabular listing of granular data such as transactions or inventory, enabling thorough audits and operational tracking.
- Group Report: A report that organizes data hierarchically by aggregating records based on common attributes, such as summarizing sales by region or category, to highlight trends and comparisons.
- Cross-Tabulation (Cross) Report: A multidimensional report format displaying data in a matrix with rows and columns representing different fields, facilitating comparative analysis across two variables.
- Master-Sub Report: A complex report combining summary (master) information with linked detailed (sub) reports, often allowing interactive drill-downs from overviews to specifics.
- Query Report: A report that extracts and presents data filtered by specific criteria or conditions, enabling tailored, on-demand analysis of subsets of data.
- Record Source: The underlying set of data (tables, queries, or both) from which a Microsoft Access report retrieves information for display.
- Report Wizard: A guided tool in Microsoft Access that assists users in creating reports by selecting fields, defining grouping and sorting, and choosing layout options without manual coding.
- Group Header/Footer: Sections in a report that respectively display the label or title of a data group and aggregate computations such as sums or averages for that group.
- Tekla PowerFab Report List: A customizable collection of reports within Tekla PowerFab tailored to user roles, enabling targeted access and management of reporting assets.
- Report Filters (Tekla PowerFab): Tools within Tekla PowerFab that allow users to apply criteria such as report type, date ranges, or parameters to narrow down and focus report content.
- User-Defined Reports (Tekla PowerFab): Custom reports created by users or administrators within Tekla PowerFab to address specific organizational needs beyond standard reporting options.
- Record Query: A database query that joins multiple tables or filters data to provide a consolidated, relevant dataset serving as the record source for reporting.