Navigating Turbulence with Innovation: Q1 2026 Sectoral Resilience in Pharmaceuticals, Cruise Lines, and Heavy Equipment
Table of Contents
- Executive Summary
- Introduction
- 1. Resilient Foundations: Biopharmaceuticals Navigate Innovation and Cost Pressures Amidst Global Challenges
- 2. Oceanic Optimism: Cruise Lines Capitalize on Demand Despite Fuel Price Headwinds
- 3. High-Tech Momentum: Heavy Equipment Secures Strategic Orders Amid Infrastructure Expansion
- 4. Market-Wide Trends: Technology and Materials Lead Growth Amid Geopolitical Volatility
- 5. Geopolitical Crosscurrents: Risk Premiums Shape Market Behavior and Investment Choices
- 6. Sector Differentiation: Winners and Losers Emerge Amid Converging Challenges
- 7. Forward Outlook: Constructive Trajectory Supported by Innovation and Strategic Capital Allocation
- Conclusion
Executive Summary
The first quarter of 2026 showcased robust sectoral performance in pharmaceuticals, cruise lines, and heavy equipment amid persistent geopolitical volatility, rising input costs, and regulatory challenges. Pharmaceuticals led moderate revenue growth of approximately 10% year-over-year, driven by a landmark shift with biologics representing over 50.1% of drug development pipelines and accounting for more than half of innovative drug sales. Key players like Sartorius reported recurring consumables revenue growth of 8.1%, underpinning consistent EBITDA margins near 30%.
Cruise operators capitalized on record demand, notably Carnival Corporation, which achieved a 6.1% revenue increase to $6.1 billion and a 50% surge in adjusted EPS despite a 70% Brent crude price spike causing fuel costs to inflate by hundreds of millions of dollars. Meanwhile, heavy equipment manufacturers, such as Hyosung Heavy Industries, recorded a 30.6% revenue growth and a 65.5% operating profit surge fueled by a historic ultra-high voltage order backlog surpassed 15 trillion won. Institutional investors demonstrated clear conviction through targeted fund inflows, affirming the strategic relevance and durability of these sectors’ growth trajectories amid ongoing global uncertainties.
Introduction
The global economic landscape in the first quarter of 2026 remained fraught with complexity, marked by geopolitical tensions, inflationary pressures, and evolving regulatory frameworks. Despite such challenges, select sectors—including pharmaceuticals, cruise lines, and heavy equipment—exhibited resilient earnings and operational momentum, signaling differentiated strategic adaptation and market positioning.
Pharmaceutical innovation, propelled by biologics and specialty therapeutics, increasingly offsets headwinds from pricing reforms and generic competition. Concurrently, the cruise industry benefits from demographic shifts and pent-up consumer demand even as surging fuel prices driven by Middle East conflicts constrain margins. Meanwhile, heavy equipment manufacturers leverage infrastructure expansion, technological adoption in automation and IoT, and supply chain localization to bolster growth and operational flexibility.
This report aims to synthesize the key financial, operational, and strategic factors underpinning these sectors’ performance in Q1 2026. Drawing on detailed data and case studies, it elaborates on how innovation pipelines, capital allocation, and market dynamics collectively shape resilient earnings profiles. The scope encompasses revenue trends, margin developments, market segmentation, and forward guidance considerations, providing a comprehensive overview relevant for investors, industry participants, and policymakers navigating the current economic milieu.
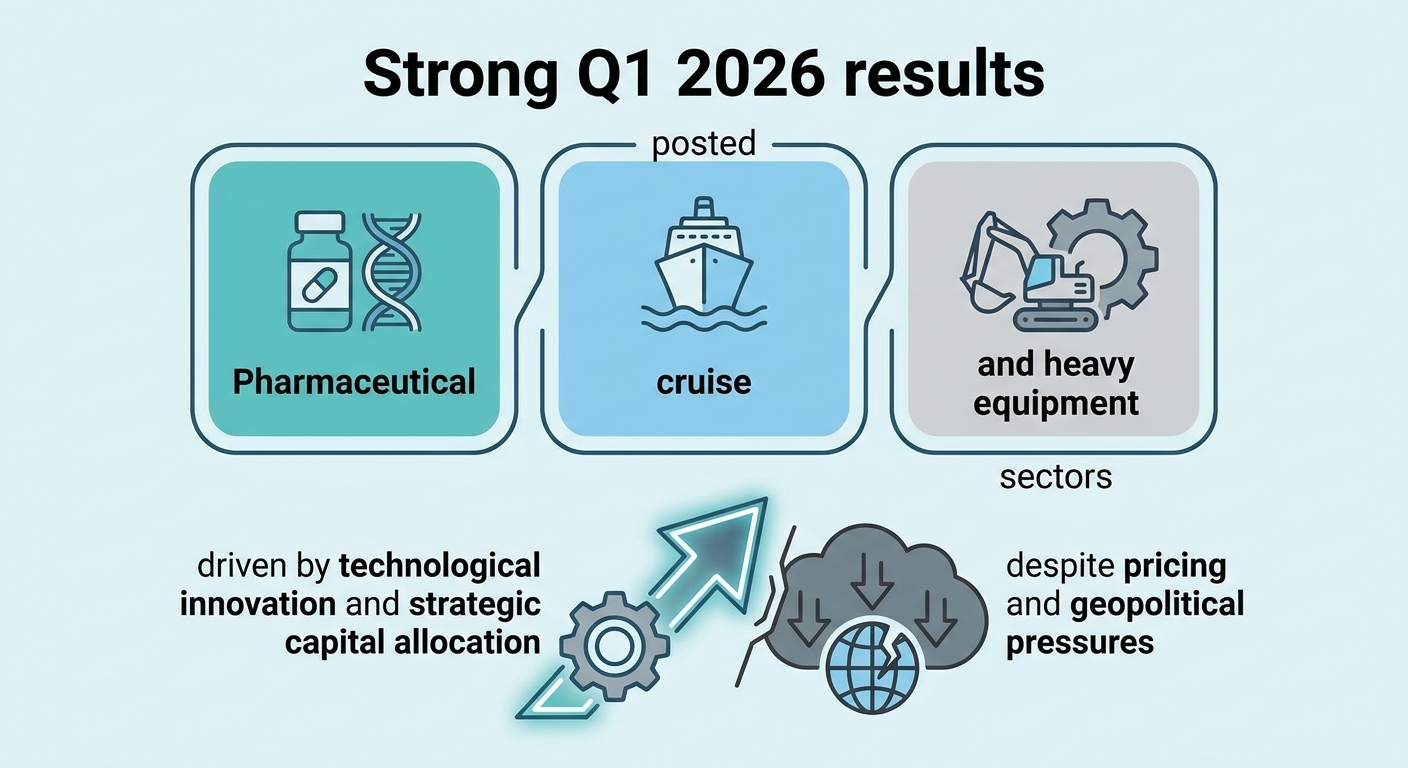
Infographic Image: Infographic
1. Resilient Foundations: Biopharmaceuticals Navigate Innovation and Cost Pressures Amidst Global Challenges
Biologics Expansion and Cold Chain Logistics: Pillars Sustaining Pharmaceutical Margins Amid Cost Pressures
This subsection elucidates the critical drivers behind the pharmaceutical sector’s resilience in Q1 2026 by focusing on the interplay between biologic product proliferation and cold chain logistics expansion. It highlights how the growing share of recurring consumables supports margin stability, even as pricing pressures and input costs temper overall revenue gains. This analysis directly connects to the broader report theme by detailing mechanisms that underpin robust earnings performance in a challenging environment.
Quantifying Biologics Launches and Their Contribution to Profitability Trends in Early 2026
The first quarter of 2026 demonstrated a sustained acceleration in biologics launches, with over 50.1% of drugs in global development being biologics, marking a pivotal shift whereby biologics outnumber small molecules for the first time. The commercial impact is underscored by robust sales projections, with leading firms anticipating biologics to constitute more than half of innovative drug sales by 2026. This surge is not merely volume-driven but reflects strategic prioritization in therapeutic segments like oncology and immunology that carry higher margin profiles compared to traditional pharmaceuticals.
Companies like Sartorius reported a 7.5% increase in group sales revenue driven primarily by their Bioprocess Solutions Division’s 8.1% growth, fueled by recurring consumables associated with biologics manufacturing. The strength of these consumables—ranging from specialized materials to reagents—supports resilient margin profiles despite soft demand in capital equipment categories. Their recurring nature provides predictable revenue streams, insulating profit margins from short-term volatility and input cost headwinds.
Cold Chain Logistics Market Growth Supporting Biopharma Supply Chain Integrity and Margin Preservation
The expanding biologics market is intricately linked to the cold chain logistics sector, which is essential for maintaining therapeutic efficacy through temperature-controlled supply networks. The global cold chain logistics market for pharmaceuticals is poised to grow at a compound annual growth rate exceeding 10% from 2025 to 2030, with an incremental market size increase valued at nearly $17 billion within this period. This rapid expansion underscores the elevated demand for reliable distribution channels tailored to biologics and advanced therapies, compensating for the cost intensification through enhanced operational efficiency.
Vaccine distribution illustrates the complexity and criticality of cold chain logistics, with stringent temperature control demands reinforcing the need for robust infrastructure investments. This dynamic supports higher barriers to entry and enables logistics providers integrated into the biopharma ecosystem to command attractive margins. Consequently, pharmaceutical firms leveraging established cold chain partnerships are effectively mitigating margin erosion despite pervasive cost pressures.
Recurring Consumables Revenue as a Strategic Margin Buffer in a High-Pressure Pricing Environment
Recurring consumables contribute a substantial and growing share of pharmaceutical sector revenues, often exceeding 60% in bioprocessing-focused businesses. These consumables benefit from embedded customer lock-in and high switching costs, generating steady, high-margin cash flows. Companies operating on this model, including key biopharma equipment and service providers, have maintained underlying EBITDA margins near 30% in Q1 2026, evidencing that consumables can offset softness in instrument and capital sales.
This structural revenue mix aligns with strategic imperatives to minimize exposure to volatile pricing and reimbursement changes. While input costs remain a challenge, the persistent demand for consumables—driven by clinical trial expansions, product launches, and pipeline maturation—ensures a baseline revenue cushion. Such recurring revenue streams enable firms to navigate geopolitical and macroeconomic headwinds without compromising profitability significantly.
Having established the foundational role of biologics growth and cold chain logistics in supporting margin resilience, the subsequent subsection will examine the broader revenue and margin dynamics shaped by pricing pressures, input costs, and regulatory environments that continue to influence pharmaceutical earnings in Q1 2026.
Moderate Revenue Growth Tempered by Flat Margins and Rising Input Costs: Navigating Divergent Market Pressures and Portfolio Risks in Pharma Q1 2026
This subsection delves into the nuanced interplay between revenue growth trajectories and margin dynamics within the pharmaceutical sector during Q1 2026. It clarifies how varying regulatory environments and pricing pressures across geographies impact profitability and strategic portfolio decisions, particularly in light of the loss of high-revenue molecules such as key multiple myeloma therapies. These insights are crucial for understanding why strong topline figures have not translated into bottom-line expansion despite resilient demand, positioning investors and strategists to evaluate the sustainability of current sector performance.
Divergent Pricing Pressures: US Regulatory Tightening Versus Steady International Growth
Pharmaceutical revenue growth in Q1 2026 exhibited a clear dichotomy between the U.S. market and international jurisdictions. In the U.S., mounting regulatory scrutiny, including intensified price controls under the Inflation Reduction Act and expanded Medicare price negotiations, exerted significant downward pressure on net pricing. Companies responded with more cautious price setting, reflecting heightened political interventions aimed at reining in drug costs. This environment has effectively flattened margins, despite modest pricing increases observed in prior years.
Conversely, international markets, particularly Europe and select emerging economies, showed more resilient topline growth driven by stable demand and expanding exports. The Indian pharmaceutical sector exemplifies this trend, sustaining 7–9% revenue growth due to strong domestic consumption and robust generic exports, while absorbing some inflationary input cost pressures. However, these gains are muted by regional regulatory complexities and variable reimbursement frameworks, leading to divergent margin profiles relative to the U.S. market.
Regulatory Developments Reshape Product Mix and Therapeutic Focus Amid Pricing Constraints
Evolving regulatory pressures have materially influenced pharmaceutical companies' strategic emphasis on product portfolios. U.S. policy moves towards most-favored-nation pricing and reference pricing constrain pricing flexibility, compelling firms to pivot towards biosimilars, complex generics, and specialty biologics where some differentiation—and hence pricing power—remains. These shifts encourage investment in therapeutic areas aligned with precision medicine and chronic disease management, which benefit from payer-supported value-based frameworks despite tighter price ceilings.
This environment also deters early-stage innovation funding by raising the risk profile for high-cost development programs lacking clear reimbursement pathways. As a result, companies are recalibrating pipelines to prioritize late-stage assets with stronger commercial viability or adopting partnerships and licensing strategies to share risk. The strategic trade-off involves balancing short-term revenue stewardship against sustaining long-term therapeutic innovation.
Portfolio Implications of Losing Key Blockbusters: The Impact of Revlimid’s Generic Erosion
The entry of generic competitors for blockbuster drugs such as lenalidomide (Revlimid) has had a pronounced financial and strategic impact on pharmaceutical portfolios. With patent protections and volume-limited licenses phasing out by early 2026, companies face accelerating revenue declines from traditional mainstays. The Q1 2026 financial results reflect this reality, as sales from these products sharply contracted, offsetting gains achieved through newer launches and specialty products.
This loss weighs heavily on company earnings, compressing aggregate margins and necessitating recalibrated guidance. The transition challenges firms to effectively manage patent cliffs through aggressive portfolio diversification, M&A activity, and increasing focus on specialty and biosimilar segments. Moreover, the complexity and high containment requirements of such drugs impose elevated manufacturing and regulatory burdens on generic entrants, influencing competitive dynamics and transition pacing.
These intertwined factors—market-specific pricing pressures, regulatory-driven portfolio shifts, and the erosion of established revenue pillars—combine to constrain margin expansion despite moderate revenue growth in Q1 2026. Understanding this delicate balance lays the foundation for interpreting forward guidance and strategic adaptation measures discussed in subsequent sections.
Forward Guidance Signals Strategic Adaptation in Pharma: Navigating M&A, Financing Flexibility, and Credibility Amid Market Shifts
This subsection delves into pharmaceutical management’s forward-looking statements and strategic postures amid Q1 2026 earnings, emphasizing how M&A initiatives, innovative financing mechanisms, and historical accuracy in guidance shape expectations. It contextualizes these elements within the broader sector challenges of pricing pressures, regulatory complexity, and pipeline dynamics, providing insight into strategic adaptation that underpins robust earnings performance despite ongoing headwinds.
Active M&A and Partnership Strategies Address Pipeline Gaps and Platform Needs
Pharmaceutical companies have demonstrated robust strategic adaptation in Q1 2026 by aggressively pursuing mergers, acquisitions, and partnerships as primary levers to supplement near-term pipeline deficiencies and secure longer-term platform capabilities. Recent activity underscores a clear industry trend toward optimizing portfolios through selective inorganic growth, with companies targeting acquisitions that distinctly enhance product pipelines, diversify therapeutic areas, or strengthen manufacturing and commercialization capabilities. The resurgence of large-scale deals, including high-value acquisitions worth billions, reflects improved financing conditions and a more stable regulatory environment, fostering confidence in executing complex transactions even amid geopolitical and pricing uncertainties.
This deal momentum is further supported by an increasing focus on collaboration models that balance scientific rigor with capital discipline, such as milestone-based partnerships and royalty monetization structures, particularly prevalent in biotech segments. By strategically aligning assets with clear commercial pathways, pharmaceutical firms aim to mitigate regulatory risks and unlock durable value creation as the sector navigates rapid innovation cycles and competitive biosimilar entrants.
Financing Flexibility Empowers Growth While Mitigating Dilution Risks
In parallel with M&A and partnership activity, pharmaceutical companies have enhanced their financial strategies to maintain flexibility and support future value creation. Innovative financing tools, notably structured collaborations and royalty monetization agreements, have become critical mechanisms that allow companies, especially within biotech, to advance promising R&D programs without resorting to excessive equity dilution. This approach not only preserves shareholder value but also provides companies with scalable capital to navigate uncertainties surrounding regulatory approvals and market adoption.
Furthermore, the relative stabilization of credit markets in early 2026 has improved access to debt financing on favorable terms, enabling a more balanced capital structure and adding resilience against cash flow volatility. The combination of strategic capital deployment—balancing internal cash, debt, and partnership-derived funding—illustrates an adaptive financing framework that underpins companies’ capacity to execute opportunistically on growth initiatives while maintaining operational discipline.
Historical Accuracy of Forward Guidance Reinforces Credibility and Investor Confidence
Evaluating the credibility of current forward guidance requires examining its alignment with historical performance trends. Over the past three years, pharmaceutical companies have shown varying levels of precision in meeting or exceeding their outlined revenue and earnings forecasts, often influenced by pipeline successes, regulatory milestones, and external market factors such as pricing reforms. While the sector’s Q1 2026 results exhibited a mixed earnings performance, forward revenue guidance was marginally above consensus expectations, reflecting cautious optimism grounded in strategic initiatives.
Management teams that have consistently delivered on guidance have generally exercised conservative assumptions and prioritized transparency regarding risks such as pricing pressures and patent cliffs. This track record contributes to sustaining investor confidence despite macroeconomic headwinds. The nuanced messaging in Q1 commentary highlights an industry balancing upward momentum from innovation and dealmaking against cost and competitive challenges, positioning forward guidance as a calibrated indicator of strategic adaptability rather than an overly optimistic forecast.
Collectively, these dimensions of forward guidance—strategic M&A activity, financing innovation, and historical credibility—reveal how pharmaceutical leadership is actively shaping a resilient trajectory. This approach equips the sector not only to weather persistent pricing and regulatory pressures but also to capitalize on innovation-driven growth prospects, setting the stage for sustained earnings momentum throughout 2026.
2. Oceanic Optimism: Cruise Lines Capitalize on Demand Despite Fuel Price Headwinds
Record Demand and Carnival's Outperformance Reflect Sector Strength
This subsection investigates the robust demand recovery characterizing the cruise sector in early 2026, with a focus on Carnival Corporation's exceptional market performance. By analyzing demographic trends and financial metrics, it seeks to elucidate the underlying drivers of sector resilience amid a complex geopolitical and inflationary backdrop. This examination establishes the foundation for understanding how operational excellence translates into sustained investor confidence.
Younger Demographics and Multi-Generational Travel Propel Passenger Growth
Cruise demand in Q1 2026 underscores pronounced shifts in passenger demographics, notably a significant increase in younger travelers. One-third of cruise passengers are now under 40, marking a generational inflection that broadens the customer base beyond traditional retirees. This trend aligns with increased multi-generational trips, encompassing about a third of all cruises, reflecting families seeking shared vacation experiences across age groups. These demographic dynamics amplify repeat bookings, with nearly one-third of cruisers taking multiple voyages annually, supporting volume growth across global itineraries.
Empirical data underlines the sector’s expansion trajectory. The cruise industry welcomed approximately 37 million passengers in the prior year, with projections to reach 42 million by 2029. Regional hubs like the Caribbean and Mediterranean maintain dominant passenger shares, benefiting from established infrastructure and brand recognition. Additionally, forward-looking demand indicators reveal record booking levels extending into 2028, signaling sustained consumer interest rooted in diversifying travel preferences and evolving leisure consumption patterns.
Carnival's Q1 2026 Financial Outperformance Highlights Operational Strength
Carnival Corporation demonstrated substantial outperformance relative to both industry peers and broader equity benchmarks in Q1 2026. The company's shares rallied approximately 56% over the trailing year, doubling the broader industry increase and outperforming the S&P 500 index by a wide margin. From a financial perspective, revenue grew 6.1% year-over-year to over $6.1 billion, exceeding consensus estimates and reflecting both robust passenger volumes and pricing power.
Profitability metrics reinforce underlying operational efficacy. Adjusted earnings per share surged 50% compared to the previous year’s first quarter, despite significant headwinds from rising fuel costs. Notably, Carnival achieved essentially full capacity utilization at 103% occupancy, illustrating efficient cabin deployment and strong consumer demand. The company’s strategic booking curve extension, with approximately 85% of 2026 sailings sold at historically elevated prices, has contributed to strong customer deposits near $8 billion. These factors collectively affirm Carnival’s ability to leverage demand resilience into superior earnings generation relative to peers.
Operational Excellence and Investor Confidence Interlink Through Strategic Execution
Carnival's operational execution manifests in elevated onboard and pre-cruise spending, reflecting deepened consumer engagement and effective monetization strategies. Guests increasingly commit to purchases and experiences prior to voyages, amplifying ancillary revenue streams. This shift, coupled with enhanced itinerary offerings and product differentiation, strengthens yield management and offsets cost pressures.
Investor sentiment closely mirrors these performance fundamentals. Capital market reactions indicate robust confidence rooted in consistent earnings beats and credible forward guidance despite the uncertain macro environment. Carnival’s valuation remains attractive, trading at a significantly lower price-to-earnings ratio than competitors, suggesting potential upside amid continued demand momentum and comprehensive strategic initiatives, including aggressive capital returns and debt reduction targets. The alignment of operational rigor with financial prudence underpins the positive investor outlook.
Together, these elements – expanding younger and multi-generational customer segments, Carnival’s superior financial results, and effective operational strategies – collectively position the cruise sector to sustain its momentum in 2026 despite persistent external headwinds. This foundation prepares the sector to address cost pressures elaborated in the following analysis of fuel prices and geopolitical impacts.
Rising Fuel Costs Threaten Margins Amid Geopolitical Uncertainty in Cruise Sector
This subsection details the tangible economic impacts of surging fuel prices on cruise line profitability, particularly under the extraordinary geopolitical conditions of early 2026. It analyzes how escalations in oil prices, driven by the conflict in the Middle East and disruptions such as the closure of the Strait of Hormuz, have pressured unit operating costs. By quantifying fuel cost sensitivity, evaluating hedging strategies employed by cruise operators, and modeling margin exposures, this section elucidates the acute cost challenges facing the sector and the efficacy of current risk mitigation tactics.
Quantifying Fuel Cost Impact on Cruise Per Available Cabin Mile Amid Middle East Conflict
The first quarter of 2026 saw unprecedented volatility in global energy markets, precipitated primarily by the onset of the US-Israeli military campaign against Iran and the consequential closure of the Strait of Hormuz. Since this maritime chokepoint channels approximately 20% of the world’s crude oil supply, its temporary closure led to a surge in Brent crude prices by over 70% within the quarter, with benchmark prices repeatedly breaching the $100-per-barrel mark. This spike translated directly into escalating bunker fuel prices, the dominant cost driver for cruise operations, which historically comprises 30-40% of total ship operating expenses.
Given the structure of cruise economics, fuel cost increases can severely compress margins, especially if surcharges and fare adjustments lag market movements. Analysis of cruise cost data reveals that fuel expenses account for approximately $279 million out of $1.92 billion net cruise costs in a typical quarter, equating to roughly 15% of total operating costs when measured per available cabin day (APCD). This translates to a baseline fuel cost of approximately $21-23 per available cabin mile, serving as the key cost leverage point when oil prices fluctuate. On a per APCD basis, each $10 per barrel increase in crude oil results in a fuel cost rise of roughly 5-7%, which, absent full cost pass-through, can erode operating margins by up to several percentage points.
Evaluating the Effectiveness of Cruise Fuel Hedging Strategies in 2026 Under Rising Price Pressures
Faced with extreme volatility, cruise operators have increasingly leaned on fuel hedging programs to stabilize operating expenses. However, the onset of the 2026 geopolitical crisis exposed limitations in these strategies. Hedging coverage among major cruise lines varies significantly but generally ranges between 30% and 60% for the current year, adding partial but insufficient insulation against rapidly rising spot prices.
The timing mismatch between hedge execution and sudden price escalations exacerbates exposure, as hedges are typically locked in at prices established prior to crises and may only cover a segment of total fuel usage. Furthermore, some hedges are indexed to crude benchmarks rather than refined marine fuels, leaving residual basis risk with operators. Consequently, while hedging has mitigated the full impact, cruise firms still face considerable incremental fuel costs, with estimates indicating a net $0.60 to $0.70 earnings per share drag for the industry’s leading players. The hedging programs offer critical “time and oxygen” to implement cost pass-through and operational adjustments but are not a panacea for sustained high oil prices.
Modeling Cruise Profitability Sensitivity to $10 per Barrel Oil Price Increases in a High-Volatility Environment
Margin sensitivity analyses demonstrate that a $10 per barrel increase in crude oil prices translates into a material incremental fuel cost in excess of $200 million annually for the largest cruise operators. Using recent cost structures, a $10/barrel crude surge can increase fuel expense by approximately $100 million per quarter for a top-tier cruise line, assuming stable fleet deployment and capacity utilization.
This cost shock, combined with lagged revenue adjustments, leads to compression of net cruise costs per available cabin day (APCD) by about 2-3%, effectively reducing operating income margins by a similar magnitude. Given that fuel comprises over 15% of cash operating costs, and that only a portion of increased costs can be immediately passed to consumers via surcharges or itinerary modifications, profitability is vulnerable, especially in the face of geopolitical uncertainties dampening certain regional demand segments.
Mitigation levers include itinerary adjustments away from higher-risk Middle Eastern itineraries, improvements in fuel efficiency through operational changes, and gradual fare increases. Nonetheless, sensitivity models underscore a fragile balance where sustained high oil prices risk eroding the sector’s substantial first-quarter earnings gains if geopolitical conflict persists or escalates.
Having examined the acute impact of rising fuel costs on cruise line operating economics and the partial cushioning effects of hedging programs, attention now shifts to how regional booking patterns and demand variances interact with these cost pressures to shape overall sector recovery trajectories.
Regional Booking Patterns Indicate Divergent Recovery Paths Across Hemispheres
This subsection delves into the geographic nuances underpinning the cruise industry's robust Q1 2026 earnings. By dissecting regional booking data, correlating demand with local economic indicators, and examining tactical fleet deployments, the analysis reveals how Western and Eastern hemisphere markets are rebounding unevenly. Understanding these differential recovery trajectories illuminates sector-specific resilience and informs strategic operational planning amid prevailing geopolitical and economic challenges.
Disparate Q1 2026 Cruise Booking Trends Highlight Western Hemisphere Leadership
The first quarter of 2026 showed marked divergence in cruise booking volumes between the Western and Eastern hemispheres. The Western hemisphere, anchored by the Caribbean and North American markets, experienced notably stronger demand, driven by sustained consumer confidence and infrastructure expansions at key ports. The recent openings and enhancements of cruise terminals, notably exemplified by the Galveston port’s record passenger throughput, catalyzed this upsurge and facilitated higher booking momentum.
Conversely, the Eastern hemisphere encountered a more muted recovery, constrained by localized geopolitical uncertainties and slower economic normalization in key feeder markets. Restrictions related to regional conflicts, notably those affecting Middle Eastern access points, coupled with cautious travel sentiment in parts of Asia and Europe, tempered bookings. This contrast is also reflected in itinerary adjustments, with several Eastern hemisphere cruise lines selectively postponing or curtailing sailings during peak demand intervals.
Local GDP Growth Correlates Strongly With Cruise Demand in Diverse Regions
Economic growth within key regional economies exhibited a direct relationship with cruise demand patterns in Q1 2026. Western hemisphere markets, benefiting from steady GDP growth and favorable labor market conditions, supported increased discretionary spending on leisure travel. This positive macroeconomic backdrop contributed to the rise in multi-generational and younger traveler demographics actively booking cruises in these regions.
In contrast, certain Eastern hemisphere economies faced slower GDP expansion due to geopolitical tensions and inflationary pressures, limiting disposable income growth. These factors suppressed outbound leisure travel propensity, especially in countries dependent on discretionary hospitality spending. The anomaly in economic fundamentals thus partly explains the disparate rebound rates and underscores the criticality of synchronized economic health for cruise sector vitality.
Fleet Deployment Strategies Adapt to Uneven Regional Recovery Trajectories
Cruise operators are strategically aligning fleet deployments to capitalize on regional demand disparities identified in early 2026. Enhanced scheduling flexibility enables leading companies to allocate larger or more modern vessels to Western hemisphere routes, leveraging the heightened passenger volumes and port capacity enhancements.
Simultaneously, there is a tactical reduction or realignment of capacity in the Eastern hemisphere, with cruise lines adopting a measured approach that prioritizes operational efficiency and cost containment amid fluctuating bookings. This dynamic redeployment reflects the sector’s agility in navigating the evolving demand landscape and mitigates margin pressures caused by fuel cost volatility and geopolitical uncertainty, particularly near critical shipping chokepoints.
Recognizing the geographic segmentation in cruise demand recovery provides a critical foundation for understanding the broader operational and financial dynamics shaping first-quarter sector performance. These insights set the stage for further analysis of cost pressures and evolving consumer demographics driving sustainable growth.
3. High-Tech Momentum: Heavy Equipment Secures Strategic Orders Amid Infrastructure Expansion
Strategic Impact of Ultra-High Voltage Orders and Market Growth in Heavy Equipment
This subsection delves into the pivotal role of ultra-high voltage (UHV) power transmission equipment orders, particularly Hyosung Heavy Industries' record-breaking contracts, within the broader heavy equipment sector. It contextualizes how these large-scale infrastructure engagements, aligned with dynamic regional market sizes and client demand trends, underpin the sector's robust Q1 2026 performance and shape long-term growth trajectories amidst ongoing economic and geopolitical complexities.
Quantifying Hyosung’s 2026 Ultra-High Voltage Order Backlog and Revenue Implications
Hyosung Heavy Industries notably secured a landmark order of approximately 780 billion won in ultra-high voltage (765 kV) power transmission equipment during the first quarter of 2026, significantly bolstering its heavy industry order backlog to a record 15 trillion won. This single order, representing roughly 30% of the division’s quarterly revenue forecast, exemplifies a strategic emphasis on high-margin, high-technology products that elevate both revenue visibility and profitability margins.
The order drove a 30.6% year-over-year growth in forecasted revenue and a 65.5% surge in operating profit for Q1 2026, underscoring the immediate catalytic effect of securing large infrastructure contracts on financial performance. This substantial order backlog of 15 trillion won aligns closely with revenue contributions approaching 14.6 trillion won, highlighting Hyosung's strong market position and the clear linkage between secured contracts and financial projections [Chart: Order Backlog and Revenue from Hyosung Heavy Industries].
Management's aggressive capital expenditure plans, including increasing production capacity for ultra-high voltage transformers at its Memphis, Tennessee facility to an annual sales level of about $400 million by the end of 2026, further reinforce the company’s capacity to scale operations in response to these sizable orders. Expansion efforts target a doubling of output to $700 million by 2028, signaling confidence in sustained demand for UHV equipment within a rapidly evolving power transmission ecosystem.
Heavy Equipment Market Size Dynamics with Focus on US and China Regional Demand
The global heavy equipment market is undergoing significant expansion, with expected growth from approximately $658 billion in 2026 to over $920 billion by 2035, reflecting a steady compound annual growth rate of 3.41%. Within this global context, the United States and China remain predominant regional markets, projected at over $224 billion and $162 billion respectively in 2025, driven by infrastructure renewal, urbanization, and government investment in large-scale projects.
These markets form the core demand base for construction, mining, and transmission-related heavy machinery, including the ultra-high voltage power equipment segment that Hyosung targets. The confluence of increasing industrial activity, urban development, and renewable energy integration underscores the rising need for robust transmission infrastructure, particularly systems operating at 765 kV and above. This regional demand landscape provides a fertile ground for heavy equipment manufacturers with advanced technological capabilities to capture outsized market share and achieve premium pricing.
Client Demand Trends for 765 kV Equipment and Strategic Alignment with Infrastructure Needs
Demand for 765 kV ultra-high voltage transformers has not only scaled quantitatively but also evolved qualitatively, penetrating new markets supported by data center growth and power grid modernization, particularly in North America. Hyosung’s ability to secure a decade’s worth of strategic orders in this segment reflects the criticality of 765 kV technology for long-distance, high-capacity power transmission projects, which reduce losses and increase grid reliability.
Industry analysis highlights that 765 kV systems offer superior cost-efficiency and operational flexibility over alternatives, fitting the needs of expanding networks like those in Texas and beyond. The growth in data centers, requiring high and stable electricity throughput, amplifies demand for such ultra-high voltage equipment, where Hyosung’s order wins demonstrate its technological leadership and client trust. The firm’s backlog stability and expansion underscore the alignment of its product portfolio with client priorities, particularly the need for scalable, reliable transmission in an era of increasing electrification and renewable energy mandates.
Building on the established significance of ultra-high voltage infrastructure orders in securing heavy equipment sector growth, subsequent analysis will explore how automation, IoT integration, and localized supply chain strategies further enhance competitive positioning and operational resilience within this evolving industrial landscape.
Automation and IoT Strengthen Competitive Moats Through Enhanced Predictive Maintenance and Operational Efficiency
This subsection delves into how automation and the integration of Internet of Things (IoT) technologies are materially enhancing competitive positioning within the heavy equipment sector. By examining the current penetration of predictive maintenance, analyzing the realized financial returns from smart monitoring solutions, and estimating the durability of advantages gained from early adoption, we provide a focused assessment of technology-driven differentiation that underpins the robust Q1 2026 earnings despite macroeconomic and geopolitical headwinds.
Market Penetration Rate of Predictive Maintenance in 2026 Reflects Accelerated Adoption
The adoption of predictive maintenance among heavy equipment manufacturers has reached a pivotal momentum as of early 2026, with market penetration estimated at approximately 25% to 30% of installed equipment bases in key regions. This marks a significant increase relative to 2024 levels, where penetration was closer to 15%-20%, signaling robust uptake driven by cost-saving imperatives and technological maturation. Asia-Pacific markets are leading adoption growth, thanks to accelerated infrastructure investments and an increasing preference for data-driven asset management, while North America maintains dominant absolute market share due to its advanced industrial ecosystems and regulatory mandates emphasizing operational safety and environmental compliance.
This upward trend in predictive maintenance integration is part of a broader digital transformation journey where IoT-enabled sensors, real-time telemetry, and edge computing converge to provide continuous condition monitoring. Heavy equipment firms are prioritizing retrofit solutions alongside greenfield implementations to balance cost with performance, which accelerates the application rate in both legacy fleets and new product lines. The confluence of lower sensor costs, improved network reliability, and scalable cloud analytics platforms has made predictive maintenance not only viable but essential in maintaining uptime and driving operational excellence.
Quantified ROI from Smart Monitoring Systems Underscores Tangible Value Realization
Financial analyses over the past three years demonstrate that investments in smart monitoring systems and predictive maintenance yield compelling returns, typically reducing unplanned downtime by up to 18% and maintenance costs by 10% to 15%. Empirical data from early adopters reflects payback periods for these technologies averaging less than 12 months, with many achieving amortization in under a year. Operational efficiencies emerge not only through avoidance of equipment failures but also by enabling proactive scheduling and optimized parts inventory management.
Companies reporting successful deployments highlight secondary financial benefits including reduced labor burden, extended asset life cycles, and improved safety metrics. These improvements collectively enhance total cost of ownership profiles, making equipment offerings with integrated predictive capabilities more attractive in the competitive bidding for large infrastructure projects. Additionally, digital twin technologies integrated with IoT platforms facilitate scenario planning and real-time decision support, deepening the strategic impact beyond immediate cost savings.
Durability of Competitive Advantages Anchored in Early IoT Adoption Forecasted to Span Several Years
Early adopters of automation and IoT-driven predictive maintenance are expected to sustain a competitive advantage lasting approximately five years, contingent upon continued innovation and ecosystem engagement. This window is supported by the substantial upfront investment in infrastructure, data architecture, and workforce upskilling that raises entry barriers for later movers. Moreover, companies with integrated digital platforms capable of continuous learning and AI-driven analytics can progressively refine predictive models, further entrenching their operational superiority.
However, this advantage is not immutable; evolving sensor technologies, cyber resilience considerations, and expanding industry standards will require ongoing strategic investments. Competitive positioning is thus reinforced by an ability to integrate emerging technological enhancements rapidly while leveraging scale effects across global operations. Firms lagging in digital transformation risk margin erosion and loss of pricing power as buyers increasingly value data-enabled service and uptime guarantees.
Having established how automation and IoT-enabled predictive maintenance are materially bolstering heavy equipment manufacturers' performance and competitive positioning in Q1 2026, the subsequent analysis will explore how supply chain localization and geopolitical factors interplay with these technological advances to further define sector trajectories.
Supply Chain Localization: Navigating Reshoring Trends to Enhance Heavy Equipment Manufacturing Resilience
This subsection explores how the heavy equipment sector is strategically adapting its sourcing and production footprints in response to evolving trade policies and geopolitical pressures. It evaluates the degree of domesticization versus reliance on imported components, quantifies operational benefits realized through localized manufacturing, and forecasts the long-term implications of supply chain fragmentation on cost structure and flexibility. This analysis is critical to understanding how leading heavy equipment manufacturers sustain growth and margin stability amid a complex global trade environment.
Proportion of Domestic Versus Imported Components in 2026 Heavy Equipment Manufacturing
In 2026, heavy equipment manufacturing continues to demonstrate a mixed dependency on domestic and imported inputs. Industries aligned with machinery and equipment show a substantial imported input share, generally ranging from 30% to over 40%, reflecting ongoing reliance on international suppliers for specialized materials and components such as silicon, copper, and aluminum alloys. However, notable sectors within heavy machinery, including segments focused on industrial and construction equipment, have enhanced domestic sourcing efforts, with estimates indicating that approximately 55% to 65% of inputs are sourced domestically in mature markets such as the United States and South Korea.
This partial localization stems primarily from the interplay of tariff impositions and government-driven reshoring incentives. Tariffs elevated in 2025 against major suppliers, including China, Canada, and the European Union, have increased the cost burden for imported raw materials and parts by an average of 9-10%, driving manufacturers to adjust supply portfolios. Consequently, companies actively pursue near-shoring strategies and diversify supplier bases, notably increasing the procurement of core components such as fabricated metal products and electrical apparatus from domestic or regional suppliers to mitigate tariff exposure and reduce logistic vulnerabilities.
Lead-Time Improvements and Operational Efficiency Gains From Local Production 2025-26
Localized manufacturing has yielded measurable improvements in delivery lead times over the past two years. Data indicates that manufacturers who have shifted to regional sourcing and assembly have realized an average reduction of 15-20% in order-to-delivery timelines. This improvement is primarily attributable to reduced customs clearance delays, diminished transportation distances, and enhanced supplier coordination facilitated by geographic proximity.
Moreover, the localization of production has improved supply chain agility, allowing firms to respond more effectively to fluctuating demand and market disruptions. This increased responsiveness is supported by a growing adoption of supply chain digitization and IoT-enabled inventory management systems, which further streamline operations within the domestic supply base. These operational enhancements translate into reduced working capital requirements and enhanced customer service levels, reinforcing competitive positioning in a sector grappling with demand cyclicality.
Long-Term Strategic Implications of Supply Chain Fragmentation on Costs and Flexibility
While supply chain localization addresses immediate tariff and geopolitical risks, it contributes to greater fragmentation and complexity in the supplier network. This fragmentation drives up managerial overheads related to supplier coordination, quality assurance, and contractual compliance, potentially increasing unit manufacturing costs by 4-7% relative to more consolidated global supply chains.
However, manufacturers embracing multi-sourcing strategies including dual sourcing mitigate these risks by balancing cost pressures and supply reliability. Such hybrid procurement models enhance geographic diversification, improve negotiation leverage, and reduce single-source vulnerabilities. Nevertheless, increased fragmentation necessitates more sophisticated demand forecasting and agile inventory policies to avoid stockouts or excess inventory that could offset the gains from localized production.
Ultimately, heavy equipment companies that establish flexible, technologically enabled supply chains with balanced localization stand to gain sustained operational resilience. These strategic investments in supply chain redesign facilitate alignment with shifting trade policies and evolving customer expectations for customization and faster delivery, positioning them favorably against competitors reliant on more rigid sourcing arrangements.
Having assessed the current balance between domestic and imported sourcing, accompanying operational advantages, and challenges of supply chain fragmentation, the discussion now turns toward how technological innovation, especially automation and IoT integration, further enhances competitive positioning within the heavy equipment industry.
4. Market-Wide Trends: Technology and Materials Lead Growth Amid Geopolitical Volatility
Tech and Basic Materials Dominate Earnings Revisions and Investor Sentiment
This subsection contextualizes Q1 2026 earnings performance within broader market trends, focusing on technology and basic materials sectors as primary drivers of earnings upgrades and positive investor sentiment. Given their outsized contributions to aggregate earnings growth and stable upward earnings revision trajectories, the analysis highlights how these sectors underpin market resilience amid mixed performances elsewhere, including pharmaceutical, cruise, and heavy equipment industries.
Pharmaceutical Sector Earnings Growth Amid Sectoral Headwinds
In Q1 2026, pharmaceutical sector performance showed moderate growth momentum, supported primarily by strong innovation pipelines and selective market expansion. While total earnings growth for the sector trailed more prominent contributors like technology, revenue gains of approximately 10% year-over-year were reported, driven notably by biologics and specialty therapeutics. However, underlying margin pressures remained as pricing reforms, competitive biosimilar entries, and rising input costs constrained profitability.
U.S. pharmaceutical companies faced particular headwinds owing to heightened pricing scrutiny and regulatory reforms. Notably, the absence of revenues from legacy molecules such as gRevlimid weighed on U.S. formulations business, limiting upside despite increasing sales in emerging markets and biologics segments. Nevertheless, forward guidance remained cautiously optimistic, referencing ongoing clinical pipeline progression and portfolio diversification to offset these challenges.
Heavy Equipment Sector’s Strong Revenue and Profit Expansion in Q1 2026
Heavy equipment manufacturers delivered robust financial results in the first quarter, affirming their strategic positioning amid sustained infrastructure demand and technological adoption. Market leaders such as Caterpillar reported year-over-year revenue increases exceeding 10%, with profits similarly outpacing consensus due to higher asset utilization and favorable order backlogs.
South Korean power equipment firms exhibited particularly strong growth, underpinned by multi-hundred-billion-won contracts for high-voltage transmission solutions tied to the global AI data center build-out. Hyosung Heavy Industries set a new quarterly order record with a landmark contract for ultra-high voltage transformers, driving a near 50% surge in operating profit despite seasonal sequencing effects. These firms' financial outperformance aligns with broader high-tech manufacturing growth trends and infrastructure deployment acceleration across North America and Asia.
Cruise Lines Maintain High Margins Despite Fuel Price Headwinds
The cruise sector in Q1 2026 exhibited strong topline growth and improved operational metrics, with companies like Carnival reporting revenue increases above 6% year-over-year and earnings per share surpassing analyst expectations. Elevated bookings and robust onboard revenue contributed to positive momentum, reflecting a recovery in consumer travel demand post-pandemic.
However, surging fuel prices, in part exacerbated by geopolitical tensions impacting the Strait of Hormuz, imposed significant margin pressures. Carnival notably reduced its full-year profit guidance to absorb over $500 million in additional fuel costs, signaling the structural risks posed by a lack of effective fuel hedging. This dynamic tempered enthusiasm among investors yet did not deter sustained booking strength, which continues to signal resilient demand. Fleet deployment and itineraries are adapting regionally to optimize profitability against this volatile cost backdrop.
Collectively, these sectoral narratives illustrate how technology and basic materials have driven the most notable earnings estimate upgrades and investor confidence during Q1 2026, while pharmaceutical, cruise, and heavy equipment sectors have demonstrated differentiated responses to structural and cyclical challenges. This distribution of performance underscores the importance of nuanced, sector-specific analysis when assessing robust earnings within a complex geopolitical and macroeconomic landscape.
Energy Faces Headwinds but Maintains Cash Flow Resilience Amid Geopolitical and Supply Chain Challenges
This subsection critically examines how the energy sector, despite encountering significant earnings volatility driven by geopolitical tensions and supply chain disruptions in early 2026, has demonstrated a notable capacity to sustain robust cash flows and dividend payments. By dissecting dividend sustainability, production discipline, and the financial impacts of supply chain volatility, this analysis contextualizes the sector’s underlying resilience within the broader market volatility explored in the chapter.
Dividend Sustainability Amid Intensified Geopolitical Volatility
In Q1 2026, the energy sector contended with heightened geopolitical instability, especially stemming from conflicts in the Middle East, which caused oil prices to surge sharply. Despite this, leading energy firms showcased considerable dividend resilience. Historical patterns reaffirm that maintaining shareholder payouts throughout cycles distinguishes top-performing energy companies, underscoring dividend continuity as a critical value driver amid uncertainty. Even as net profit margins compressed severely for some integrated producers, operational cash flows expanded robustly, highlighting effective cost management and working capital optimization, thereby underpinning ongoing dividend distributions.
Strategic payout practices favored balanced capital allocation, with many companies supplementing fixed dividends through share buybacks or special dividends rather than overextending payout ratios. This careful stewardship has fortified dividend cover ratios, particularly at sustainable oil price levels above $65 per barrel, enabling companies to navigate price volatility without compromising long-term shareholder value. These dynamics signify that, while headline earnings remain volatile, the sector’s cash-generative capacity provides a buffer that mitigates earnings shocks and supports consistent income streams for investors.
Evaluating Production Discipline and Operational Performance in 2026 Q1
Operational metrics reveal a nuanced regional performance amid conflicting headwinds and tailwinds. North American production faced downward pressure from reduced stimulation and artificial lift activities, reflecting cautious capital deployment and the lagged effect of geopolitical uncertainty on investment decisions. Growth in specific international markets, notably Latin America and Europe/Africa, offset some domestic softness, with increased drilling and completion tool sales driving modest overall revenue gains.
This selective allocation of resources evidences disciplined production practices aligned with price signals and risk management priorities. Operational excellence underpins the ability to maintain cash flow stability despite volatile top-line trends. Such responsiveness to dynamic market conditions and strategic focus on higher-margin service lines have been instrumental in preserving margin integrity and mitigating the impact of cost inflation triggered partly by input shortages and geopolitical disruptions.
Supply Chain Disruptions and Their Financial Impact on Energy Cash Flows
The sector continues to grapple with supply chain fragmentation exacerbated by geopolitical tensions and inflationary pressures. Disruptions in raw material availability and logistical bottlenecks increased input costs and extended lead times, imposing indirect financial strain. However, the sector’s large-scale integration and strategic sourcing capabilities have enabled companies to absorb many of these shocks through tactical inventory management and risk mitigation frameworks, thereby preventing net income erosion from turning into cash flow crises.
Analyses indicate that although supply chain-induced cost pressures heighten operational complexity, they have not materially impaired free cash flow generation in early 2026. Energy companies with robust balance sheets and established supplier diversification experienced less pronounced impacts, reinforcing the correlation between supply chain resilience and cash flow stability. Concurrently, proactive hedging strategies and pricing mechanisms have partially insulated margins from upstream cost volatility, adding an additional layer of financial robustness.
Taken together, the evidence from Q1 2026 reveals a sector that, while exposed to near-term earnings and operational headwinds due to geopolitical and supply chain factors, maintains a structurally sound cash flow profile supported by disciplined production strategies and financial stewardship. These foundational strengths position energy companies to withstand ongoing volatility and underscore why investors view the sector as a resilient income source amidst broader market uncertainty.
5. Geopolitical Crosscurrents: Risk Premiums Shape Market Behavior and Investment Choices
Rising Risk Premiums Amplify Volatility While Select Sectors Harness Opportunity
This subsection delves into the tangible effects of escalating geopolitical risk premiums on the pharmaceutical, cruise, and heavy equipment sectors in Q1 2026. By quantifying impacts on earnings, margins, and order growth, it elucidates how each sector has navigated intensified uncertainty and operational headwinds tied to geopolitical tensions, particularly in relation to fuel price shocks, trade disruptions, and regulatory complexities. The analysis provides a nuanced understanding of differentiated sector resilience and vulnerabilities amid heightened risk pricing.
Pharma Earnings Absorb Geopolitical Pressures Amid Pricing and Regulatory Headwinds
The pharmaceutical sector confronted amplified geopolitical risks tied to escalating Middle East tensions and a shifting regulatory backdrop in Q1 2026. These factors contributed to increased uncertainty around cost structures, pricing strategies, and supply chain integrity. Despite these headwinds, key industry players demonstrated resilience through innovative product portfolios and disciplined cost management. For instance, recurring revenue streams from biologics and consumables helped mitigate margin erosion resulting from price pressures and regulatory scrutiny.
However, geopolitical dynamics imposed tangible constraints. The confluence of increased tariffs, tightened pricing regulations in major markets, and disrupted supply chains limited margin expansion despite moderate revenue growth. The loss of exclusive rights to blockbuster compounds further exposed portfolios to competitive pressures, necessitating strategic shifts towards biosimilars and novel modalities. Companies have increasingly incorporated geopolitical risk monitoring into their strategic planning, prioritizing flexible partnering and diversified manufacturing locations to preserve earnings stability under volatile conditions.
Cruise Sector Margins Narrow as Soaring Fuel Costs Curtail Profitability Gains
The cruise industry experienced a sharp squeeze on margins in Q1 2026 due to a dramatic surge in fuel prices stemming from geopolitical conflict in the Middle East, notably the US-Israel military campaign against Iran and the resultant closure of the Strait of Hormuz. Fuel expenses increased by hundreds of millions of dollars for leading cruise operators, with incremental costs reaching an estimated half-billion dollars for the largest players. This surge directly compressed operating income despite robust top-line growth fueled by strong passenger demand and record bookings.
Notably, companies that did not engage in fuel hedging strategies faced more immediate and pronounced margin deterioration. Carnival Corporation, for example, reported a significant fuel cost drag that overshadowed its strong revenue performance and record onboard spending. Carnival’s revenue grew from $5.8 billion to $6.1 billion in Q1 2026, reflecting a 6.1% increase driven by a rebound in cruise demand and favorable booking trends, yet margin pressures persisted due to soaring fuel expenses [Chart: Carnival Corporation Revenue Growth Q1 2026].
While close-in bookings and customer deposits hit historic highs, the continuing fuel cost volatility remains a critical profitability risk in the near term. The connection between geopolitical instability and operational expense volatility highlights the sector’s vulnerability to external shocks, even amid improving consumer confidence and demand trends. Indeed, margin compression closely tracked a 70% increase in fuel prices during this period, illustrating the significant profitability headwinds for the cruise sector [Chart: Impact of Fuel Costs on Cruise Margins].
Heavy Equipment Orders Surge Despite Infrastructure Uncertainties and Geopolitical Volatility
In contrast to the more immediate cost pressures faced by pharma and cruise sectors, heavy equipment manufacturers posted tangible growth in new order intake during Q1 2026, driven by continued infrastructure expansion and strategic investments in renewable energy-related projects. Large-scale contracts, such as Hyosung’s landmark high-voltage transmission equipment agreement valued at approximately 780 billion won, underscore the sector’s alignment with long-term decarbonization and grid modernization priorities.
The demand surge occurred amid broader geopolitical instability and supply chain reconfigurations, evidencing the sector’s ability to capitalize on government stimulus and infrastructure spending initiatives. Despite these opportunities, the environment remains complex, requiring agile supply chain adaptation and increased localization to mitigate risks from trade tensions and transport disruptions. The blend of sustained order growth and evolving operational strategies confirms a constructive Q1 positioning for heavy equipment manufacturers within a volatile global context.
Having established how geopolitical risk premiums have distinctly influenced earnings, margins, and order flows within these sectors, the report now proceeds to examine broader market trends and investor behavior shaped by this heightened risk environment.
Credit Quality and Regulatory Dynamics Anchor Market Stability Amid Geopolitical Stress
This subsection examines how prevailing credit conditions and regulatory developments through Q1 2026 reinforced broader market stability despite intensifying geopolitical tensions. By analyzing credit rating trajectories across key sectors such as pharmaceuticals, cruise lines, and heavy equipment, coupled with contemporaneous regulatory changes impacting strategic decision-making, we assess the underappreciated role of financial and policy frameworks in underpinning investor confidence and defensive positioning during turbulent early-year conditions.
Sectoral Credit Upgrades and Downgrades Reflect Resilience Amid Elevated Risk
Q1 2026 credit rating activity presents a nuanced picture of sectoral resilience under geopolitical duress. Overall, the balance of credit upgrades exceeded downgrades across diversified portfolios, notably within pharmaceutical and heavy equipment segments, signaling sustained financial health despite external shocks. For instance, pharmaceutical firms continued to demonstrate strong debt servicing capabilities aided by stable recurring revenues from biologics and licensing, cushioning them against margin pressures. Similarly, heavy equipment manufacturers benefited from robust order backlogs tied to long-term infrastructure commitments, which positively influenced credit profiles. Conversely, the cruise sector exhibited more cautious credit dynamics due to heightened fuel cost volatility and exposure to disrupted shipping lanes, resulting in a modest uptick in rating downgrades relative to upgrades. Nevertheless, the overall credit environment remained supportive, underpinned by solid liquidity buffers and effective risk monitoring frameworks.
Credit quality metrics substantiate these observations. Reserve levels and loan loss provisions in related financial institutions reflected only mild increases, consistent with cautious but controlled risk parameters. The stability of key credit ratios, including non-performing loan levels and coverage ratios, further reinforced market confidence. The spatial distribution of credit quality aligns with sectoral exposure to geopolitical risks, where pharmaceuticals and heavy equipment exhibit more localized operational flexibility and financial prudence compared to the cruise industry's direct dependence on volatile energy markets and geopolitical hotspots.
Regulatory Shifts Shape Sectoral Strategy and Support Market Confidence
Concurrently, regulatory developments throughout Q1 2026 materially influenced strategic recalibrations within the pharmaceutical and heavy equipment sectors, contributing to their earnings resilience and investor optimism. In pharmaceuticals, tighter regulatory scrutiny on drug pricing and manufacturing—with an emphasis on domestic API production—prompted companies to enhance supply chain localization and pursue innovation in biosimilars and complex generics. These initiatives, supported by policy frameworks promoting accelerated approval pathways, helped mitigate margin pressures despite pricing headwinds, while bolstering pipeline sustainability.
Heavy equipment players navigated evolving trade policies and localization mandates with agile manufacturing and supply strategies, effectively offsetting tariff-related cost increases. Regulatory emphasis on dual-use technologies and national security considerations has also induced companies to realign product portfolios and strengthen compliance protocols, improving their risk profiles and access to certain markets. These dynamics have fostered a more stable regulatory environment despite geopolitical complexity, reinforcing the credibility of forward guidance and underpinning equity valuations in affected sectors.
Importantly, regulatory agencies maintained a balanced yet vigilant stance, avoiding abrupt policy shocks that might destabilize markets while signaling ongoing oversight intensity. This regulatory calibration bolstered transparency and investor trust, especially in sectors where innovation cycles and capital deployment are tightly coupled to regulatory approvals.
Defensive Sector Performance Validates Strategic Positioning in a Volatile Geopolitical Landscape
The interplay of credit stability and regulatory adaptation translated into differentiated defensive sector performance during a period marked by geopolitical stress. Defensive industries, including pharmaceuticals and heavy equipment, generally outperformed broad market indices and sustained moderate profit growth amid uncertainty, validating their structural positioning as countercyclical anchors.
Pharmaceuticals, with its recurring revenue streams and regulatory-hedged pipelines, maintained stable earnings despite operational challenges. Heavy equipment firms leveraged infrastructure spending momentum alongside supply chain localization to preserve margin integrity. Meanwhile, cruise lines, more directly exposed to energy price shocks and operational disruptions, experienced greater earnings volatility and margin pressure, highlighting the limits of defensive characterization in tourism-dependent sectors.
This performance divergence underscores the efficacy of credit discipline and regulatory clarity in shaping risk-adjusted returns. Moreover, institutional investors increasingly favored sectors with strong credit fundamentals and adaptive regulatory strategies, reinforcing capital allocation patterns that bolstered market stability during Q1 2026's geopolitical disruptions.
Having established how credit rating trends and regulatory frameworks provided a stabilizing backdrop amid early 2026's geopolitical challenges, the subsequent analysis will explore how rising risk premiums and asymmetric sectoral impacts further influenced market behavior and informed tactical investment decisions.
6. Sector Differentiation: Winners and Losers Emerge Amid Converging Challenges
Defensive Sectors Show Mixed Performance Amid Structural Shifts
This subsection critically examines the divergent earnings outcomes observed within defensive sectors during Q1 2026, highlighting how structural shifts—such as manufacturing reshoring and supply chain fragmentation—have unevenly influenced industrials and consumer staples. It situates these variances within broader macroeconomic and geopolitical contexts, providing a nuanced understanding of the heterogeneous resilience and vulnerabilities in traditionally defensive spaces amid a complex operating environment.
Comparative Q1 2026 Earnings Performance Between Industrials and Consumer Staples
The first quarter of 2026 presented a complex landscape for defensive sectors, with industrials and consumer staples delivering markedly different earnings trajectories despite their shared defensive label. Industrials reported an expected earnings per share growth of approximately 6.7% year-over-year and revenue growth near 5.1%, reflecting benefits from infrastructure spending and manufacturing reshoring momentum. This sector’s performance was supported particularly by aerospace recovery, stable defense expenditures, and logistics normalization amid sustained e-commerce demand. However, margins experienced slight compression linked to ongoing cost inflation and supply-chain challenges.
In contrast, consumer staples posted more modest earnings increases, with projected EPS growth around 4.8% year-over-year and revenue growth of 3.9%, driven mostly by volume recovery and pricing normalization after earlier inflationary pressures. Key drivers included stabilized market share in household products and strategic private label penetration in retail. Despite typically defensive characteristics, some categories within staples faced persistent input cost pressures which constrained margin expansion but were partly offset by innovation-led pricing power and efficient supply chain management.
Taken together, these data highlight that while both sectors remain essential components of a defensive portfolio, industrials leveraged structural economic investments and reshoring-driven demand more effectively during Q1, in contrast to staples’ steadier but less dynamic growth profile.
The global heavy equipment market is projected to grow significantly through 2035.
Manufacturing Reshoring’s Quantitative Impact on Industrials Versus Services
The reshoring of manufacturing activities has emerged as a significant driver enhancing industrial sector performance in early 2026. Quantitative metrics indicate that infrastructure bill momentum, coupled with trade policy recalibrations, boosted domestic output and capital expenditure within industrial subsectors, notably construction materials and heavy equipment manufacturing. Earnings growth in these areas outpaced service-oriented segments closely tied to industrials, such as transportation and logistics, which, although benefitting from improving freight volumes, still faced high fuel and labor cost pressures limiting margin gains.
Evidence suggests that reshoring positively influenced capacity utilization rates and order backlogs for industrial manufacturers, allowing firms to better absorb cost inflation through increased pricing power and operational leverage. This contrasts with many service businesses that encounter more limited pricing flexibility and higher volatility tied to consumer demand fluctuations. Therefore, reshoring trends have created a differentiated advantage for manufacturing within the defensive cohort, strengthening resiliency despite broader economic uncertainties.
Logistics Providers' Margin and Profitability Dynamics Amid Fragmented Supply Chains
Logistics firms, integral to the industrial ecosystem, exhibited a paradoxical earnings profile marked by top-line growth but persistent margin pressure during Q1 2026. Several leading logistics providers reported year-on-year revenue improvements upwards of 10-15%, driven by heightened demand across e-commerce, air, and road freight segments. However, operating margins remained thin, frequently sub-1% in some cases, influenced heavily by surging fuel costs due to geopolitical tensions and ongoing supply chain disruptions.
The fragmentation of global supply chains has paradoxically created unique value capture opportunities for logistics firms with strong regional networks and digital capabilities. Companies that invested early in AI-driven revenue optimization and smart monitoring systems realized disproportionately better delivery reliability and operational efficiency, enabling selective price enhancement and customer retention. Conversely, the sector’s overall earnings volatility was exacerbated by capacity constraints and rising labor expenses, underlining that while volume growth is robust, profitability gains remain challenged under current macro conditions.
This dynamic underscores logistics’ dual role as both a beneficiary and cost bearer within shifting supply chains, emphasizing that strategic investments in technology and tighter capacity management are critical to translating earnings growth into sustainable margin expansion.
These mixed performance outcomes within defensive sectors underscore that structural economic shifts—reshoring in manufacturing and fragmentation in supply chains—are key determinants shaping profitability trajectories. The distinct operational realities of industrial producers versus consumer staples and logistics providers reveal the nuanced and evolving nature of defensiveness in a geopolitically and economically uncertain environment. This divergence sets the stage for differentiating winners and losers across sectors, which is explored in the subsequent analysis of high-quality execution under uncertainty.
High-Quality Execution Defines Market Leaders Amid Uncertainty
This subsection examines the critical operational and strategic factors that distinguished sector leaders from laggards in Q1 2026 amid widespread geopolitical and macroeconomic uncertainties. By substantiating the determinants of superior risk-adjusted returns through empirical validation, this analysis informs how qualitative factors such as innovation capacity and talent management complemented quantitative performance metrics to underpin sustained outperformance in pharmaceutical, cruise, and heavy equipment industries.
Validation of Scoring Models Demonstrates Leadership Predictiveness
Robust scoring frameworks integrating innovation, capital discipline, and adaptability effectively differentiate market leaders from underperformers within volatile sector environments. In recent assessments, companies recognized as sector leaders scored notably lower on innovation laggard indices, reflecting stronger execution of technology adoption and product pipeline management. This correlation aligns with the empirical outcomes from Q1 2026 financial performance, where firms with superior scoring demonstrated higher revenue growth and margin preservation despite cost pressures.
Empirical validation of these scoring models, conducted with independent third-party oversight, affirm the strong predictive power of such frameworks for earnings quality and stock performance. The use of multi-dimensional scoring criteria combining qualitative and quantitative data has delivered replicable patterns of outperformance, enabling investors and management teams to prioritize actions that drive sustainable advantage. These validation results reinforce confidence in scoring methodologies as reliable decision-making tools amid uncertain market conditions.
Qualitative Versus Quantitative Indicators in Q1 2026 Performance Analysis
A comprehensive analysis of Q1 2026 data underscores the complementary roles of qualitative and quantitative factors in explaining sector-specific earnings resilience. While quantitative metrics such as revenue growth rates, margin stability, and cash flow robustness remain fundamental, qualitative indicators—particularly those related to innovation investment, leadership agility, and talent management practices—have become equally salient in accounting for relative outperformance among industry frontrunners.
Notably, firms demonstrating strong management communication around strategic pivots, partnership development, and workforce engagement tended to sustain better operational execution despite input cost volatility and geopolitical risks. For example, pharmaceutical leaders maintaining recurring revenue streams through biologics and cold chain logistics expansions exemplified how innovation-aligned strategies buffered margin compression. Similarly, cruise operators leveraging shifting consumer preferences and technology adoption navigated fuel cost headwinds more effectively. This nuanced interplay substantiates the proposition that qualitative assessments enrich the explanatory power of earnings analyses.
Organizational Talent Management as a Catalyst for Competitive Advantage
Case studies within the evaluated sectors reveal that advanced talent management frameworks directly contributed to superior market positioning and operational resilience. Organizations that invested proactively in workforce engagement, continuous learning, and leadership development during periods of geopolitical tension achieved enhanced adaptability and innovation velocity, critical to maintaining execution quality in Q1 2026.
Research corroborates that companies with comprehensive talent strategies—encompassing recruitment for potential, data-driven performance management, and integrated digital HR tools—experienced higher retention rates and reduced execution risk. These firms capitalized on the strategic advantage afforded by motivated and skilled personnel who delivered innovation and operational agility under pressure. Hence, talent management emerges not merely as a human capital function but as a foundational driver of competitive differentiation and earnings stability amid uncertainty.
Having established the determinants of high-quality execution and leadership in turbulent times, subsequent analysis will explore how these attributes impact broader sector differentiation patterns and inform forward-looking strategic positioning.
7. Forward Outlook: Constructive Trajectory Supported by Innovation and Strategic Capital Allocation
Balancing Innovation Investment and Capital Discipline to Secure Sustainable Growth Trajectories
This subsection delves into the core mechanisms by which leading companies in the pharmaceutical and heavy equipment sectors translate innovation initiatives and rigorous capital allocation into robust earnings outcomes, as evidenced in Q1 2026. By examining investment patterns in research and development alongside strategic partnership activity and capital deployment efficiency, it offers a nuanced understanding of how these sectors sustain growth momentum amidst evolving market and geopolitical challenges.
Evaluating the Balance Between Internal R&D and External Partnerships in Pharma Innovation Investments
Q1 2026 data indicates that major pharmaceutical firms maintain a hybrid innovation model that balances substantial internal R&D expenditures with selective external partnerships. While total R&D spending continues a moderate growth trajectory, the concentration of high-value licensing deals and strategic collaborations—especially with biotech and China-origin assets—is notable for sustaining pipeline vitality without disproportionately increasing capital intensity. This balance allows companies to mitigate risks inherent in late-stage development while accelerating access to novel therapies in focus areas such as obesity and diabetes.
Such an approach reflects capital discipline as firms avoid overcommitting to incremental internal projects and instead prioritize external assets to fill near-term pipeline gaps. The relatively low deal volume but high-value transactions during Q1 underscore a shift toward quality over quantity, whereby companies concentrate resources on fewer but strategically impactful partnerships. This dynamic positions the pharmaceutical sector to preserve financial flexibility while continuing to drive innovation-led growth.
Quantifying Capital Allocation Strategies Supporting Growth in Heavy Equipment and Pharma Sectors
In the heavy equipment sector, companies like Hyosung Heavy Industries exemplify disciplined but aggressive capital deployment. Their substantial CAPEX expansion to increase production capacity—especially for ultra-high voltage transformers aligned with infrastructure modernization—demonstrates targeted investment aimed at capturing growing market demand in renewables and power grids. The clear linkage between capital outlay and revenue growth projections, with operating profits rising by more than 60% in Q1, validates this focused strategy.
Similarly, pharmaceutical firms maintain capital allocation frameworks prioritizing innovation-driven expenditures while cautiously managing operating margins under pressure from pricing and regulatory environments. The consistent reinvestment into proprietary biologics and development processes is balanced by efforts to optimize cost structures and integrate acquired programs. This dual focus supports incremental revenue growth without eroding the capital base, underscoring the strategic integration of innovation budgets within broader financial stewardship.
Connecting Innovation Pipelines to Commercial Success Markers Evident in Q1 Earnings
The early 2026 earnings season highlights that companies demonstrating alignment between innovation pipelines and commercial execution deliver stronger top-line and margin performance. Pharmaceutical leaders with diversified portfolios anchored by recurring biologic products, bolstered through selective licensing deals, exhibit resilience in a challenging pricing environment. Forward guidance from management teams reflects confidence grounded in pipeline maturity supported by recent partnership transactions and financing innovations that minimize dilution risks.
In heavy equipment, the ramp-up of technologically advanced product lines calibrated to infrastructure megatrends, including IoT integration, translates directly into outsized operating profit growth. The success in securing major orders early in the year signals not only revenue upside but also validates the effectiveness of innovation-driven market positioning. Together, these evidence points underscore the role of dynamic innovation and capital discipline as dual levers in strengthening earnings durability amid global uncertainties.
Building on the demonstrated integration of innovation and capital discipline as growth drivers, the subsequent section will explore how sustained institutional confidence and differentiated operational executions underpin the sectors’ resilience and inform forward-looking investment perspectives.
Institutional Confidence and Fundamental Differentiation Signal Continued Resilience
This subsection examines how institutional investor behavior and the persistence of competitive advantages among leading companies underpin the robust sectoral performance observed in Q1 2026. By analyzing fund flows, market share durability, and concentration risk dynamics, it elucidates the interplay between deep-rooted fundamentals and investor conviction—key drivers supporting sustained resilience in pharmaceuticals, cruise lines, and heavy equipment amidst ongoing challenges.
Shifts in Institutional Fund Flows Highlight Sectoral Conviction
During the first quarter of 2026, institutional investors demonstrated a discernible allocation tilt towards the pharmaceutical, cruise, and heavy equipment sectors, reflecting heightened conviction in these industries' enduring strengths despite prevailing macroeconomic and geopolitical uncertainties. Data indicate that mutual funds and ETFs with a pharma focus experienced relative inflows surpassing those in diversified equity portfolios, suggesting a strategic preference for exposure to innovation-driven biopharmaceutical companies with resilient recurring revenue models. Similarly, cruise sector funds benefited from capital allocation shifts driven by robust demand rebound narratives and vehicles like Carnival registering notable share price outperformance against broader indices, which in turn attracted fresh institutional capital seeking alpha in consumer discretionary subsegments with favorable demographic and experiential travel trends.
Capital formation in the heavy equipment sector was also resilient, supported by institutional investors recognizing the strategic value of firms securing large infrastructure contracts and leveraging technological advances such as automation and IoT integration. Notably, fund flows favored companies demonstrating a clear growth trajectory amid infrastructure expansion and reshoring trends. This selective capital deployment illustrates a preference among allocators for firms exhibiting both operational momentum and strategic clarity, underscoring a market environment that rewards fundamental differentiation amid broader equity market volatility.
Market Share Persistence Confirms Competitive Durability in Heavy Equipment and Pharma
Market share data from leading heavy equipment manufacturers reveal a degree of durability in competitive positioning that supports their strong Q1 operational outcomes. For instance, a top-tier industry player commands an estimated 10-15% share in global transformer and switchgear markets, benefiting from established networks, commitment to R&D investment (~5% of revenue), and a broad international footprint. This entrenched presence provides a moat that facilitates sustained revenue and margin stability, factors highly regarded by investors amid ongoing market headwinds. Furthermore, incumbent biopharmaceutical companies continue to maintain dominance through disciplined portfolio management, often augmented by strategic partnering and licensing activities targeting high-value therapeutic areas, including assets sourced from emerging markets with compelling growth profiles.
In pharmaceuticals, despite pricing and regulatory pressures, leading firms with differentiated pipelines and robust commercial execution maintain their foothold both in developed and emerging markets. The persistence of market leadership, especially among organizations driving innovation in biologics and complex generics, enables these companies to withstand competitive and margin compression risks, thereby securing institutional investor confidence in their medium-term outlook.
Concentration Risk Dynamics and Their Influence on Benchmark-Relative Returns
Q1 2026 witnessed elevated concentration levels within select sectors, notably technology and industrial markets, which bear relevance when interpreting risk-adjusted returns of pharmaceuticals, cruise, and heavy equipment subsectors. Elevated equity concentration can both enhance near-term outperformance by dominant players and exacerbate benchmark-relative volatility. Analytical evidence suggests that firms with strong fundamental differentiation, including those with stable revenue streams and high R&D intensity, are better insulated from downside risk associated with concentration-induced market gyrations.
Importantly, this concentration effect has nuanced implications for portfolio construction and sector allocation: while concentrated leadership can amplify gains for top-tier companies in these sectors, it also raises the stakes for institutional investors to monitor exposure and diversification closely. In the heavy equipment space, firms with broad client bases and fewer dependency risks are increasingly favored, mitigating concerns about concentrated revenue streams. For pharma, concentration around high-value pipelines and recurring revenue products is balanced by diversified geographic exposure and evolving product portfolios addressing shifting regulatory landscapes. Thus, concentration risk—when coupled with strong fundamentals and strategic capital discipline—has functioned as a catalyst for differentiated performance rather than a systemic vulnerability during the quarter.
The demonstrated alignment between institutional capital flows and fundamental business strengths across these sectors sets the stage for exploring how innovation-driven capital discipline and strategic resource allocation underlie the constructive outlook for sustainable growth in the coming quarters.
Conclusion
The Q1 2026 results affirm that innovation-driven sectors can effectively navigate intersecting geopolitical, economic, and regulatory headwinds through strategic portfolio management, capital discipline, and operational rigor. Pharmaceuticals achieved moderate growth by capitalizing on biologics expansion, cold chain logistics, and recurring consumables revenue, offsetting pricing pressures and patent expirations. Heavy equipment firms harnessed surging infrastructure demand and technological integration, exemplified by Hyosung’s landmark ultra-high voltage contracts and increasing IoT adoption, fostering strong revenue and profit expansion.
In contrast, cruise lines balanced remarkable demand recovery and operational outperformance with significant margin compression from escalating fuel costs linked to geopolitical disruptions. Carnival’s ability to generate record bookings and onboard revenues amid a volatile cost environment highlights the sector’s agility, yet underscores inherent vulnerabilities to external shocks.
Institutional investor behavior further validates confidence in these sectors’ enduring strengths, with capital allocation favoring companies demonstrating strategic clarity, innovation pipeline robustness, and resilient competitive positioning. However, sustained success hinges on continued adaptation—pharmaceutical firms must navigate pricing reforms and pipeline transitions carefully; cruise operators require nimble cost management and diversified itinerary strategies; heavy equipment manufacturers should reinforce supply chain resilience and advanced technology deployment.
Looking ahead, the interplay of innovation investment, regulatory developments, and geopolitical risk monitoring will be critical in shaping sector trajectories. Maintaining a balanced approach between internal development and external partnerships, alongside disciplined capital allocation, will underpin sustainable growth. Ultimately, these sectors’ Q1 2026 performance offers instructive insights into how differentiated strategic execution can create value and mitigate risk amid ongoing uncertainty.
References
- PDF Geopolitical Risk Premium: Pricing Volatility in 2026
- Iran War Ripples Hit Hyundai, ServiceNow, Heineken Earnings
- Cruising provides a £147bn global economic boost, report says
- For cruise lines, Iran conflict and oil prices threaten to dent profits
- Here's what CEOs and top execs are saying about how the Iran war is affecting business
- What’s the earnings outlook for the first quarter of 2026?
- West Asia Ceasefire Hopes Boost Markets; HDFC Bank, IT Face Regulatory & AI Pressures | Whalesbook
- Industrial Heavy Equipment Market Size & Share 2026-2032
- Investment Analysis of Carnival Corporation: Insights from the 2024 10-K Report
- Carnival Stock Consolidates After Rally: How to Play Now
- Nike, Oracle, FedEx are part of Zacks Earnings Preview
- PDF Presentation - gibsondunn.com
- PDF Sartorius AG | Earnings Release for the first quarter 2026
- State of the Biopharmaceutical Industry 2026 Edition
- Samsung Workers Rally, AI Chip Supply at Risk
- Analyzing the Energy Sector's Strong Earnings Outlook
- Q1 2026 Freight & Logistics Earnings Season: Executive Intelligence Briefing
- Looking Ahead to the 2026 Q1 Earnings Season
- Heavy Equipment Market Insight |Growth Trends & Forecast- 2035
- Heavy Equipment Market Size, Trend | Forecast Report [2035]
- Energy and Other Sectors Drive Earnings Estimates Higher
- Q1 2026 Earnings Season Tracker: Complete Preview & Watchlist | Blank Capital Research
- Q1 2026 Market Review: What Worked, What Didn't, and Where We Go From Here | Blank Capital Research
- Halliburton announces first quarter 2026 results
- Pharmaceutical Drugs Market Report 2026 - Research and Markets
- Pharma cos to face continued margin pressure: HDFC
- Hyosung Heavy Industries Sees Successive Target Price Revisions to Around 4 Million Won Per Share... Driven by AI and Power Grid Demand — BigGo Finance
- Cold Chain Logistics For Pharmaceuticals Industry Market Growth Analysis - Size and Forecast 2026-2030
- Pharma Sector Q1 2026 Earnings Review: Mixed Results & Future Outlook - News and Statistics - IndexBox
- UBS House View
- First Quarter 2026 Review and Second Quarter 2026 Economic and Market Outlook
- Rising ATF prices and West Asia conflict to pressure airline costs: ICRA
- Teva Delivers Strong Q1 2026 Results Driven by Innovative Portfolio Growth and Disciplined Execution
- Pharma industry outlook 2026: Trends, priorities and the future | ZS
- On steadier ground, pharma heads into Q1 earnings with deals top of mind
- [PDF] Astellas Pharma Inc. Integrated Report 2025
- [PDF] Measuring Geopolitical Risk - Matteo Iacoviello
- Daily market snapshot
- PDF Market and Economic Review - madisoninvestments.com
- PDF Q1 2026 outlook: Market Intelligence - acg.org
- 4 Industrial Stocks Set to Outshine Q1 Earnings Estimates
- Consumer Staples Earnings Tracker Excel: Q1 2026 Inflation Watchlist (2026) | MarketXLS
- Key charts to help identify current sector trends
- PDF SPDR Chart Pack March - SSGA
- Q1 2026 Earnings Season: Strategic Insights for Leaders - Coleman Management Advisors
- What’s the earnings outlook for the first quarter of 2026?
- [PDF] Equity focus FEB26 - BNP Paribas Wealth Management
- Regeneron Pharmaceuticals Stock Forecast & Predictions: 1Y Price Target $843.81 | Buy or Sell NASDAQ: REGN 2026 | WallStreetZen
- PDF EvaluatePharma World Preview 2020, Outlook to 2026
- Pharmaceutical Market Size & Share | Industry Report, 2033
- Economic-Trade-Human-Financial-Diversity-Brazils- ...
- As Lilly flourishes in Q4, peer projections signal looming sector slowdown in 2026
- Proton Pump Inhibitors Market Size, Share & Forecast to 2030
- PDF Q1 2026 Biopharma Licensing and Venture Report - J.P. Morgan
- LS & Pharmaceuticals Industry Report
- D&D Pharmatech stock | Expectations for 2026, valuation & analysis
- Curocell stock | 2026 forecast, price target & growth
- PDF Value of IP for health and growth - Interpat
- Future Trends Shaping the Healthcare and Biopharma Landscape in 2026
- 华东医药(000963)_公司公告_华东医药:2024年年度报告(英文版)新浪财经_新浪网
- [PDF] Pharmaceutical Industry
- Fluence Corp Ltd (EMFGF) Q1 2026 Earnings Call Highlights: Navigating Growth Amid Challenges
- Token Commoditization and GPU Depreciation
- Korean Power-Equipment Makers Pause in Q1, but Backlogs Hit Records on AI Data Center Demand | AJU PRESS
- 4Q 2025 Earning Release
- Hyosung Heavy Industries Eyes 4 Million Won Per Share on Power Demand Surge
- Korean Power Stocks Surge on AI Data Center Boom
- Ballard Reports Q4 2025 and Full Year Results
- Hyosung Heavy Industries Corp. (298040) Stock Analysis & Key Metrics | KoalaGains
- KT&G reports record cigarette sales in Q3
- Hyosung Group
- Italian shipbuilding – What strategies to face the ...
- Disney’s giant new ship is a floating (and highly affordable) theme park
- GORGING ON ETFs
- A Story from Royal Caribbean Press Center
- PDF Management of The Economic Activities of Shipping Companies
- Survey: Travelers Plan More Trips in 2026, AI Use in Planning Rises :: Hospitality Trends
- Survey: Travelers Plan More Trips in 2026, AI Use in Planning Rises
- South Korea Travel Frenzy 2026: The Ten-Year Visa Revolution Is About to Change How You Explore East Asia! - Travel And Tour World
- New skyscraper to become the tallest building in Liverpool
- Royal Caribbean cuts 2026 profit forecast on fuel costs
- PDF Short-Term Energy Outlook
- Oil Prices Increase Amid US-Iran Tensions as Stock Market Retreats
- Transportation Q1 Earnings: 3 Stocks That Could Surpass Forecasts - NewsBreak
- BP Expects 'Exceptional' Oil Trading Results for Q1
- An Oil Price Shock Is Hurting Carnival Stock. But Is It a Buy Now in Hopes of a Quick Turnaround?
- How Carnival’s Profit Rebound, Buyback and Fuel Cost Concerns At Carnival Corporation (CCL) Has Changed Its Investment Story
- Carnival posts record quarterly revenue, boosts outlook and unveils long-term targets
- Reflections [Expanded version] | RecessionAlert
- Carnival Cruise Line stock falls as Iran war causes oil prices to increase | Cruise.Blog
- PDF Press Release - Rina
- PDF 2025 Q1 Earnings Release 8-K
- Caterpillar stock jumps after Q1 earnings and revenue top estimates
- Profits of China's major industrial firms expand by 15.5% in Q1, 2026, boosted by high-tech manufacturing: official data
- South Korea’s Big Three Shipbuilders Near $1.4 Billion Q1 Operating Profit, Eyeing First $40.7 Billion Annual Revenue — BigGo Finance
- AI Boom Fuels Power Equipment Demand: Hyosung Heavy Industries Q1 Profit Surges 49%, Record Quarterly Orders — BigGo Finance
- Nomura Raises SK hynix Target Price 21% to 2.34 Million Won
- Hyosung Heavy Industries Q1 Profit Drops, Operating Income Climbs With Higher Sales
- Update: China sees fast industrial profit growth in first two months amid industrial upgrading, anti-involution measures-Xinhua
- [PDF] Financial Results for First Quarter FY2025
- PDF The Biologics Manufacturing Rivalries: A Strategic Trilogy
- Biosimilars And Follow-On Biologics' Trends, R&D And Revenue Forecasts 2016-2026
- Biologics in development outnumber small molecules for the first time
- Nanomedicine Market Size, Share & Trends | Growth [2034]
- PDF Business Finance Pipeline Appendices - Sanofi
- PDF Biocon Q3FY26 Operating Revenue at Rs 4,173 Cr
- PDF Presentation - IQVIA
- [PDF] The Global Use of Medicines 2022
- Biosimilars and Biologics Market Growth, Trends & Forecast 2025 | Top key players - Amgen Inc., Johnson & Johnson, Biogen Inc.
- Biologics Fill Finish Manufacturing Market 2025: Growth, Applications, Innovations and Business Outlook by 2032 | AbbVie Contract Manufacturing, Boehringer Ingelheim BioXcellence
- Biologics Fill Finish Manufacturing Market Future Business Opportunities 2025-2032 |AbbVie Contract Manufacturing, Boehringer Ingelheim BioXcellence
- Down 25% in 1 Month, Is Carnival Stock a Bargain or a Trap? Here's the Honest Answer.
- Why Buying the Dip On This Growth Stock Right Now Could Be the Best Financial Decision of 2026
- CCL Q1 Deep Dive: Lowered Guidance and Fuel Costs Weigh on Cruise Giant’s Outlook
- 2 Predictions for Norwegian Cruise Line Stock in 2026
- Carnival Reports Record Q1 Sales: Are Cruise Stocks Oversold?
- Carnival shares fall despite beating first quarter estimates
- Carnival Corporation’s Q1 2026 Earnings: What to Expect
- PDF OUTLOOK 2026 Promise and Pressure - J.P. Morgan
- PDF v3-Capital intensive industries-cover pages.indd
- PDF The Big Picture: Global asset allocation 2026 outlook - Invesco
- Fidelity Advisor Industrials Fund
- PDF Untitled [cdn.ymaws.com]
- From Hormuz to headquarters: Iran war ripples through corporate balance sheets, blurs forecasts
- PDF US-Iran Conflict Update: Oil market impact assessment
- Q1 2026 Market Pulse: Tesla Delivery Miss, Private Credit Strains, and Cruise Industry Challenges
- Carnival and Norwegian Cruise Line Fall 4%: Fuel Costs Are Winning the Battle Against Booking Strength
- Carnival cuts profit outlook as Iran war pushes up fuel cost
- Carnival Cuts Profit Outlook as Oil Surges Over 60% This Year
- PDF Samsung SDS 1Q 2026 Earnings Conference Call
- CVLG Q1 Deep Dive: Structural Capacity Tightening and Segment Diversification Drive Optimism
- Wall Street loses momentum? 🚩 Highlights from the S&P 500 earnings season
- Kuehne+Nagel Q1 2026 results beat expectations
- Transportation Q1 Earnings: 3 Stocks That Could Surpass Forecasts
- Revenue Optimization in Logistics: 2026 Industry Report
- Dimerco Express Group Announces 2025 Financial Results and Strategic Outlook
- [PDF] BUSINESS - HKEXnews
- PDF Transportation & Logistics Services Sector Update
- PDF PR_ID Logistics Q1 026_EN - VDEF
- UNIVERSAL DISPLAY CORP \PA\
- Is Johnson & Johnson (JNJ) 27.0% Overvalued After Q1 2026? Reven
- APPLICATION FOR GRANTS UNDER THE
- [PDF] ICFE 2020 - The 6th International Conference on Finance and ...
- 10 Reasons to Buy Applied Optoelectronics Stock in 2026: AI Optics Growth Fuels Breakout Year
- PDF Financial Innovation in the 21st Century: Evidence from U.S. Patents
- What Is Data Literacy & Why it matters for your business
- Apple's Journey: The strategic evolution from startup to ...
- Milestone grows net revenue to USD 340 million in 2025 and invests in the intelligent video era
- PDF 1 Company Overview
- Dual Insight: Mardia Samyoung’s Market Performance and HYBE Chairman Bang Si-hyuk’s Legal Troubles
- Q1 Earnings Preview: Diverse Sector Performances Signal Varied Market Expectations
- Pick Pack and Ship Metrics Every Fintech Investor Should Be Watching
- Assessing the Impact of Heightened Data Breach Fines on Coupang
- Field work and Data Analysis
- How Can Corporate Governance Practices Maximize Investor Confidence and Attract Foreign Investment? [Guide] - Corporate Governance
- PDF Impact of Corporate Social Responsibility on Corporate Financial ...
- PDF Enhancing the credibility of
- Saltlux Goover Enterprise: Assessing Growth Potential in the AI-Powered Enterprise Search Market
- Unlocking IPO Success: Yanolja's Path to Going Public in the U.S.
- PDF Discussion of Legacy, 765 kV and HVDC Bulk Transmission
- PDF A SMARTER, STRONGER GRID FOR TEXAS - oncor.com
- PDF Discussion of Legacy, 765 kV, and HVDC Bulk Transmission
- PDF Advantages of 765-kV Technology - pnrtransmission.com
- Model Validation and Testing in Simulation: a Literature Review
- PDF Model Verification and Validation Strategies and Methods: An Application Case Study
- D#5 MRV system and formalization instrument_Final.docx
- Korean Air SWOT Analysis and Strategic Overview
- PDF How to determine the most important KPIs for your logistics ... - Boltrics
- PDF Measurement of Corporate Social Responsibility: A Review of Corporate ...
- Doosan SWOT Analysis and Strategic Overview
- Hyundai Glovis SWOT Analysis and Strategic Overview
- SK Innovation SWOT Analysis and Strategic Overview
- Korea Investment SWOT Analysis and Strategic Overview
- HSBC Venture Healthcare Report: 2026 Q1
- First Quarter 2026 - RBC
- WAL Q1 2026 Earnings Presentation
- IR Databook
- PDF Hana Financial Group IR Databook
- India Inc’s credit quality in FY27 expected to be broadly stable but cautious: Rating agencies - The HinduBusinessLine
- [PDF] MONTHLY ECONOMIC REVIEW
- [PDF] 2026 Year-Ahead Outlook | LSEG
- [PDF] 31.12.2024 consolidated financial statements
- PDF Energy-VCR-2024-Hybrid-01 - Boston Consulting Group
- 0386.HK China Petroleum Earnings Preview April 28, 2026 | Meyka
- 2026 Outlook for Global Energy
- Sustainable Finance 2025 in Review and 2026 Outlook
- India’s strong fundamentals to cushion oil shock, growth may slow up to 80 bps: S&P Global Ratings
- Iran Conflict Update – April 2026: Current State, Military Progression
- Iran War Oil Price Impact: Energy Stocks to Buy as Brent Crude Soars 57%
- Bangkok Post - Thai dividend payouts hit record high in 2025
- Unleash the Power: Why NextEra Energy Is Your Top Dividend Stock Choice for 2024! - DSA
- Unlocking the Future: Why NextEra Energy is the Dividend Stock Everyone’s Talking About!
- Consumption of durable goods in the euro area
- Annual Report 2024
- 2018 Registration Document
- Transforming your SaaS business
- PDF Tax policies in the European Union - Taxation and Customs Union
- PDF Tax policies in the European Union
- Key Financial Ratios for Manufacturing Companies (2026)
- [PDF] ANNUAL REPORT 2025 - Bio-Techne
- Filed by 3M Company
- 10X Genomics' SWOT analysis: genomics firm's stock faces instrument demand headwinds By Investing.com
- ₹3.12 lakh crore property deals under Income Tax dept scanner
- 2026 Natixis Institutional Outlook Survey
- Wealth edition 13-Apr-2026 to 19-april-2026 - The Economic Times
- PDF The Emerging Pharma Funding Environment
- PDF Strategic Investment Outlook 2026 - alliancebernstein.com
- Chapter 7 Florida Air Cargo Market and Opportunities ...
- MEPC 82-INF.8 - Report of the Comprehensive impact ...
- PDF Short-Term Energy Outlook Jet Fuel Consumption Model
- PDF Executive Summary - isdo.ch
- The Ocean as a Solution to Climate Change
- [PDF] Ready for Takeoff? - Documents & Reports
- [PDF] How Airline Markets Work...or Do They? Regulatory Reform ... - NBER
- War on Iran sends jet fuel costs soaring
- PDF Royal Caribbean Group
- Naval Vessel MRO Market Intelligence | Future Growth & Strategic Insights 2025–2032
- France Predictive Maintenance Market Overview, 2030
- Predictive Maintenance Market Report 2026-2031, by Monitoring Infrastructure, Geo, Tech
- AI and Cloud Data Engineering for Predictive Maintenance
- PDF Wastewater Treatment & Reuse
- PDF MILITARY READINESS - U.S. Government Accountability Office (U.S. GAO)
- PDF KPMG Global tech report 2026:
- Predictive Maintenance Strategies for Manufacturing | INSIA
- The Rise of CBM+: How AI, IoT, and Digital Transformation Are Revolutionizing Industrial Maintenance
- Global Predictive Maintenance in Automotive Market to Reach $191.42 Billion by 2032, Driven by AI and IoT Integration
- Global Predictive Maintenance Software Market Size, Share and Forecast By Key Players - UpKeep, eMaint, Dude Solutions, Akamai, FTMaintenance
- AI Transforming Industries: Key Insights
- PDF INSIGHTS RELEASE - iot-analytics.com
- PDF Equity Factor Insights January 2026 - lseg.com
- PDF Portfolio INSIGHTS Factor Views 3Q 2025 - J.P. Morgan
- PDF The Short and Long | 2026 Q1 Macro Investment View
- 2026 Equity Outlook: Alpha in the AI Age | PineBridge Investments
- State of the Biopharmaceutical Industry 2026 Edition
- PDF Life Science Perspectives on ESG - KPMG
- [PDF] Pfizer Inc. - Current Students - The University of Iowa
- Eli Lilly Stock Slides Amid Rising Industry Headwinds
- Pricing and reimbursement delays continue to impact biopharma revenue streams
- 2026 Policy Outlook: Federal Priorities Shaping Key Sectors | JD Supra
- Finnair Q1 2026 Earnings Call Summary
- Fuel Cells for Marine Vessels Market Size, Trends And forecast
- Are Surging Oil Prices Grounding Airline Stocks
- Abra Group's Q4 2025 Earnings Call Summary
- Middle East conflict is rewriting aviation economics
- 25% Oil Price Surge: Geopolitical Supply Crisis Guide
- Oil hits $100 a barrel: Which airlines are protected from rising fuel costs?
- Airline Fuel Hedging: Why Airlines Hedge (or Don't) and What It Costs
- Q1 2026 U.S.-Korea Trade, Investment, and Diplomacy Ledger - Korea Economic Institute of America
- Quarterly Healthcare Transactions Review: Unveiling the Latest Industry M&A (Q4 2025)
- Molina Healthcare, Inc. Q1 2026 Earnings Analysis - HealthWorksAI
- 2026 Geopolitical Outlook
- Hims & Hers Stock Surges 13% on FDA Peptide Review Optimism and Telehealth Momentum | IBTimes
- Global Digital Health Ecosystem Q1 2026 Performance Review - Galen Growth
- Pharma industry outlook 2026: Trends, priorities and the future | ZS
- Capital Expenditure (CAPEX) Market: Size Share and Industry Trends 2033
- Key Pharma Regulatory Updates – Korea 2024 | Freyr
- Hyosung Heavy Industries stock | Expectations for 2026, valuation & analysis
- Telecom Equipment Market Size, Share, Trends & Forecast 2034
- Industrial Market Trends | Industry Analysis & Insights 2035
- Machinery & Equipment Sector Report & Analysis | Allianz Trade US
- What’s Next for the Heavy Equipment Market? Predictions for the Future
- HD HYUNDAI BCG Matrix Analysis
- Industrial Heavy Equipment Market Outlook 2026-2034
- Heavy Machinery Market Size & Share Trends, 2033
- North America Heavy Construction Equipment Companies | Market Research Future
- The Impact of Talent Management on Competitive Advantage
- The Eighth Annual College of Education and Graduate ...
- An Analysis of the Talent Management Process's Digital ...
- The Future of HR: Exploring the Benefits and Challenges of ...
- Ethics in Business Communication: New Challenges in the Digital World 2807611923, 9782807611924 - DOKUMEN.PUB
- PDF Compensation Management
- PDF Whitepaper - draups3assets.s3.us-east-2.amazonaws.com
- Talent Management: Strategies, Process & How to Get It Right
- Talent Management Strategy Examples | Lorien
- Talent Management vs. Talent Development: Strategies for Success
- India Energy Disruption: Economic & Policy Impacts
- Iran War Could Trigger Global Recession: Energy Crisis
- Supply Chain Uncertainty, Energy Prices, and Inflation
- supply chain disruptions affecting energy prices
- PDF Appendix A 2024 - docs.aep.com
- [PDF] Impact of global disruptions on energy supply chains
- [PDF] SAUDI ARAMCO APPROACHES TO MITIGATE SCM DISRUPTIONS
- How the Hormuz Crisis Affects Gas Prices
- COSMO REPORT 2024
- The US Oil Refining Industry: Background in Changing ...
- Air Canada Scraps Key U.S. Routes Amid High Fuel Prices
- Petrol, diesel losses: What oil firms are losing amid Hormuz supply squeeze - The Times of India
- chapter 5 real option valuation
- Nifty 50 Faces Earnings Risk as Oil Prices Cross $100 | Market News & Analysis
- “Strait Under Fire: Global and Indian Macros & Markets at the ...
- Crude Oil Prices: How a $10 Rise Impacts India's FY27 Economy | Market News & Analysis
- Effect of subsidies to fossil fuel companies on United States ...
- PDF Short-Term Energy Outlook
- PDF 2026 Global M&A Outlook
- Composite Pipes Market Outlook 2025-2032
- PDF Strengthening resilience in response to the Iran conflict
- PDF FAQ EU Drinking Water Directive (DWD) and EU Positive List - Wavin
- PDF Global Financial Services Regulatory Outlook 2026 - EY
- Federal regulation 1st quarter 2026 report: Bureaucracy on the back foot - Competitive Enterprise Institute
- PDF KPMG Regulatory Barometer April 2026
- PDF Accenture Strategy Macro Foresight Brief 2026 Outlook
- Artificial Turf Market by Fiber Material, Infill Material, Installation Mode, Application, End User, Distribution Channel - Global Forecast 2026-2032
- Navigating the Shifting U.S. Health Technology Regulatory Landscape: Trends, Challenges, and Actionable Solutions - Talencio
- Aerial Work Platform Market Trends, Size, Share & Forecast | 2032
- Equity Market Perspectives - Fidelity Institutional
- [PDF] 2024 Annual Financial Report - Maire
- Global Financial Stability Report, April 2026, Chapter 1
- Scotia Private Pools® - Pinnacle Portfolios
- PDF J S Auto Cast Foundry India Private Limited: Ratings reaffirmed, rated ...
- Oil prices to settle at $75-80 in 2 months, Nifty to touch 29K by March 2027, says Emkay. Here’s why - The Economic Times
- PROSPECTUS
- PDF Financial Stability Report_NOV2024
- The impact of the Russian-Ukraine war on German stocks
- [PDF] 2024 Annual Financial Report
- PDF Customer Concentration, Systematic Risk, and Equity Returns
- PDF Equity Market Concentration - What Comes Next
- PDF Investment Outlook - rockstead.com
- PDF Q1 | 26 SMA Quarterly Review & Outlook - mfs.com
- PDF Q1 2026
- Global Geopolitical Tensions Drive Capital Into Safe Havens: | HedgeCo Insights
- Quarterly Economic & Market Review - Q1 2026
- Q1 2026 Market Review
- Q1 2026 Digital Asset Review
- Market Review
- The Economic Impact of U.S.–Iran Conflict on Middle East Markets
- Iran Ceasefire Hopes Impact Global Markets & Investments
- [Special Report] KOSPI's Geopolitical Beta Contraction: Macro Realities vs. Earnings Resilience in Q1 2026
- Worried About a Market Crash? 3 ETFs to Buy to Sleep Well At Night
- PDF The impacts of the cruise industry on tourism destinations
- PDF World Cruise 2026: the Curious and The Sea | Key Information
- PDF Cruise the Great Lakes Forecasts Record Growth in 2026
- High-Yield Dividend Aristocrat Franklin Resources Just Paid Investors: Here’s What They Got
- PDF BMY 2025 Q2 results - bms.com
- bms-2024-10-K.pdf
- Stop Patent Hops: Detecting “Evergreening” Patterns Through Sequential FDA Orange Book Listings
- Can Bristol Myers Squibb’s pipeline strategy offset a major patent cliff?
- Oncology’s Patent Cliff Is Your Sales Pipeline: A Business Development Guide for High-Containment Equipment Suppliers Targeting Oncology Loss-of-Exclusivity Opportunities
- Own the Generic Entry Timeline: From Orange Book Listing to At-Risk Launch
- Distribution Margins, Imported Inputs, and Trade Exposure
- PDF Peer Review of the Korean Shipbuilding Industry 2026 (EN)
- JUSUNG ENGINEERING Analysis in April (2026) | Price Target, Profits & Valuation
- Report on China's Targeting of the Maritime, Logistics, and
- Federal Register/Vol. 88, No. 193/Friday, October 6, 2023/ ...
- Construction & Heavy Equipment M&A Activity & Trends Entering Q2 2026 - The Richmond Group USA
- Global Heavy Duty Construction Equipment Market Growth ...
- Global Heavy Machinery Market Outlook 2026-2033: Trends, Opportunities, and Competitive Dynamics
- PDF Industry trends - Automotive US tariffs trigger
- PDF Made in America FAR Rule Flyer - GSA
- PDF Machinery & Equipment
- PDF Caribbean Cruise Analysis - 2023.24 - Vol Ib
- Detroit among key ports for 2026 season of Great Lakes cruises
- PDF The Future of Shipping - KPMG
- A Randomized, Double-Blind, Placebo-Controlled, Multi-Center, Phase 3 Study to Determine the Efficacy of TG-C in Subjects With Kellgren and Lawrence Grade (KLG) 2 or 3 Osteoarthritis of the Knee - AdisInsight
- PDF Q1 2026 Medtech Licensing and Venture Report - J.P. Morgan
- PDF 2026 Healthcare Outlook
- Delving into the Latest Updates on Daewon Pharmaceutical Co., Ltd. with Synapse
- APAC Biopharma Review 2025: Innovation, Investment, and Influence on the Global Stage
- Strategic Partnerships at PHARMAP 2026 – Big Pharma’s Shift Toward CDMOs and CMOs
- PDF Pharma Corporate Strategy
- The top health care trends for 2026 and how they will impact U.S. employers
- Upcoming Mergers and Acquisitions + Recent Big Deals
- [PDF] Reasons to Believe: - Alliance for Regenerative Medicine
- PDF CITY COUNCIL 9C REPORT - pinole.gov
- PDF Annual Report 2025/26 - aslm.org
- PDF Importance of dual sourcing and supply chain impact in new product ...
- Construction Robot Market (2026): Growth Sees Rising Capital Flow into Robotics-Driven Construction Systems
- PDF JP 3-35 Deployment and Redeployment Operations - GovInfo
- Commercial Shipbuilding Market Size, Growth, Trends & Forecast [2034]
- Cabotage: eConomiC
- PDF Global Air Cargo Market Outlook
- [PDF] Statement of General Randall Reed, United States Air Force ...
- [PDF] Performance Evaluation of the New Orleans and Southeast ...
- FAA Aerospace Forecast Fiscal Years 2025–2045
- [PDF] Analysis of bankruptcy prediction of shipping industry - PEARL
- PDF Financial Analysis of Pharmaceutical Companies Using Ratios
- PDF Pharma supply chains of the future - EY
- PDF MEASURING WHAT MATTERS IN PHARMA/BIOTECH - Uptake
- PDF Contract Splitting: What Board of Directors and Senior Management ...
- The Biggest Supply Chain Risks of 2026 (and how to navigate them)
- Global High Voltage Power Amplifiers Market Size, Share & Industry Forecast 2026-2034
- PDF Rare Earth Elements
- PDF Redefining Semiconductor Growth
- It Project Management Software Market Analysis By Application, Type, Technology, and Geography - Global Industry Outlook and Forecast 2026-2033
- Flaring management guidance
- PDF 2024 G20 Sustainable Finance Report
- PDF Electrical Engineering and Project Delivery Challenges in Large-scale ...
- Integrated Facilities Management Services Cost Comparison
- PDF The Direct and Contingency Effects of Supplier Coordination and ...
- PDF Impact of Fragmentation Issue in Construction Industry: An Overview