Navigating the 2026 Strait of Hormuz Crisis: Global Oil Supply Shocks, Market Cascades, and Macroeconomic Implications
Table of Contents
- Executive Summary
- Introduction
- 1. Diagnosing the Global Oil Supply Shock: Strait of Hormuz Blockade and Its Cascading Effects
- 2. Monetary Policy Crosscurrents: Inflation Trajectories and Central Banking Dilemmas
- 3. Foreign Exchange Realignments: Safe-Haven Flows and Balance-of-Payments Stress
- 4. Portfolio Implications: Equity Rotations and Volatility Regimes
- 5. Strategic Pathways: Mitigation Options and Diplomatic Leverage Points
- 6. Scenario Projections: Oil Price Paths and Macroeconomic Ripple Effects
- Conclusion
Executive Summary
The 2026 closure of the Strait of Hormuz by Iranian forces has precipitated an unprecedented disruption in global oil flows, eliminating approximately 16-18 million barrels per day — nearly 80-90% of the daily 20 million barrel transit volume through this critical chokepoint. This supply shock has triggered extraordinary market reactions, including the Brent-Dubai spread peaking near $85 per barrel and Dubai crude prices surging to $170, well beyond prior geopolitical crises. The closure has forced major shipping lines to suspend routes and compete for limited alternative export capacities that cover only 30-40% of the lost throughput, compounding global supply tightness.
Monetary authorities face acute inflationary pressures, with oil prices persistently above $100 per barrel portending headline inflation increases exceeding 4% and embedded core inflation persistence. Central banks, notably the US Federal Reserve, maintain hawkish stances to anchor inflation expectations, delaying rate cuts through 2026 despite growth deceleration risks. The US dollar strengthened by 5-7% versus major currencies, while vulnerable emerging market currencies like the Indian rupee hit record lows amid capital flight and rising import bills. Equity markets rotated decisively toward defensive sectors, compressing risk, while strategic reserves releases—though at record scales totaling 400 million barrels—offer limited medium-term relief. Diplomatic mediation and alternative route expansions remain critical for resolving structural deficits and mitigating protracted stagflation risks.
Introduction
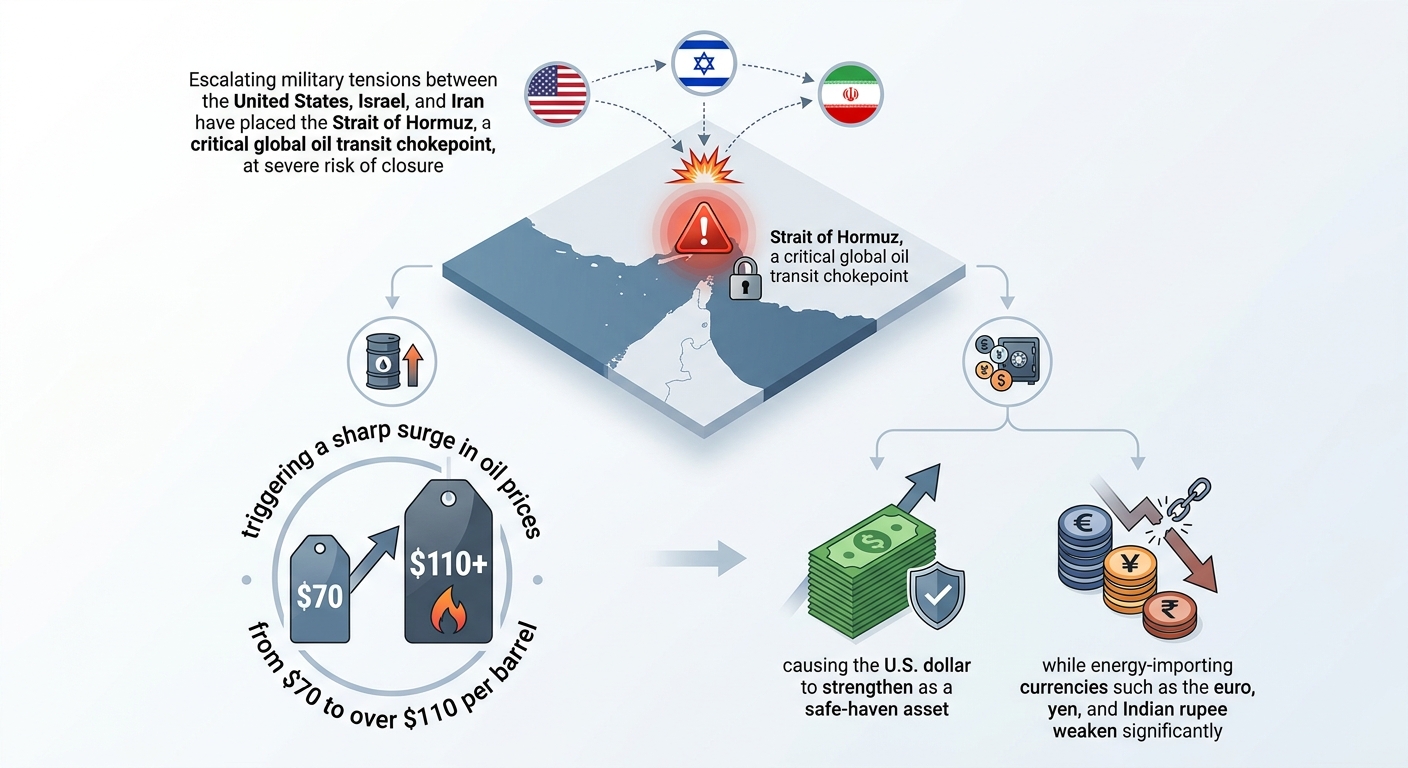
The Strait of Hormuz, a narrow maritime passage linking the Persian Gulf to the Arabian Sea, fundamentally underpins global energy security by facilitating roughly one-fifth of the world's daily oil supply. In early March 2026, escalating geopolitical tensions culminated in Iranian forces effectively closing this vital corridor, triggering the most significant disruption to global oil transit since the 1973 Arab oil embargo. This blockade, compounded by related military strikes and strategic countermeasures, has unleashed cascading consequences across commodity markets, international shipping logistics, and macroeconomic domains worldwide.
The ensuing global oil supply shock is characterized by immediate and severe contractions in available crude volumes, unprecedented price dislocations, and heightened risk premiums embedded throughout commodity and financial markets. Established maritime operators, including Maersk and MSC, have suspended all voyages through the Gulf region, forcing reliance on alternative and capacity-constrained pipelines and extended shipping routes around the Cape of Good Hope. This reconfiguration has aggravated bottlenecks, escalated freight costs, and intensified supply uncertainty, reverberating well beyond energy markets into agriculture, industry, and consumer goods sectors.
This report aims to comprehensively diagnose the evolving global energy crisis by quantifying supply chain disruptions, analyzing price transmission mechanisms from crude benchmarks to retail and industrial costs, assessing monetary policy challenges amid inflationary shocks, and evaluating foreign exchange realignments and portfolio impacts resulting from heightened geopolitical risk. Additionally, it explores strategic mitigation options, diplomatic leverage points, and scenario projections outlining potential futures for oil prices and macroeconomic stability. The analysis targets policymakers, investors, and corporate strategists seeking actionable insights to navigate a rapidly evolving and volatile landscape.
Infographic Image: Infographic
1. Diagnosing the Global Oil Supply Shock: Strait of Hormuz Blockade and Its Cascading Effects
Critical Infrastructure Under Siege: Quantifying the Strait of Hormuz Disruption and Compounding Military Impacts
This subsection establishes the concrete physical realities of the ongoing supply shock by quantifying the scale and operational consequences of the Strait of Hormuz blockade. It lays the groundwork for understanding how this chokepoint disruption cascades into broader market volatility and economic instability. Detailed examination of shipping suspensions and military escalations clarifies the disruption’s severity and temporality, enabling precise evaluation of current and future supply constraints.
Quantifying Daily Oil Throughput Lost Amid Strait Closures
The Strait of Hormuz currently facilitates approximately one-fifth of the global daily oil supply, equating to nearly 20 million barrels per day. Since Iranian forces effectively closed the strait in early March 2026 amidst escalating conflict, the normal oil transit volume has been drastically curtailed. Real-world tanker traffic has plummeted, with several shipping lanes operating at a virtual standstill, directly reducing daily throughput by an estimated 80-90%. This reduction effectively removes close to 16-18 million barrels per day from accessible global supply, a volume unprecedented since the 1973 Arab oil embargo and markedly greater than the Russia-Ukraine crisis disruptions of 2022.
This concrete volume contraction figures critically into global oil market tightness, fueling price spikes and compounding refinery feedstock shortages internationally. The persistent closure extends losses daily, imposing mounting pressure on inventories and strategic reserves.
Current data confirm that daily throughput losses have dropped from typical levels of 20 million barrels per day to approximately 2 million barrels per day during the blockade, underscoring the severe scale of the disruption [Chart: Global Oil Throughput Loss Amid Strait of Hormuz Blockade].
Operational Impacts of Major Shipping Line Suspensions and Trade Route Disruptions
Major global shipping operators including Maersk, Hapag-Lloyd, MSC, CMA CGM, and Ocean Network Express have suspended all transit voyages through the Strait of Hormuz and adjacent Arabian Gulf waters, citing unsustainable security risks and prohibitive war-risk insurance premiums. This coordinated halt has effectively frozen maritime transportation networks servicing the Persian Gulf, increasing shipment lead times as vessels are rerouted around the Cape of Good Hope. Such detours add approximately 15 to 20 days to transit schedules, reducing effective fleet capacity by an estimated 10-15% due to extended operational cycles and increased fuel consumption.
In addition to increased transit times, these adjustments contribute to significant bottlenecks at alternative ports and logistical hubs, compounding the downstream supply chain stress beyond energy commodities to encompass broader industrial and consumer goods sectors. The massive rerouting also raises overall freight costs, insurance premiums, and market volatility.
Compounding Effects of U.S.-Led Military Strikes on Supply Channel Bottlenecks
The initiation of coordinated U.S. and Israeli military strikes against Iranian military and nuclear infrastructure rapidly escalated regional security risks, triggering Iran’s retaliatory closure of the strait and missile strikes targeting energy infrastructure across several Gulf countries. These military actions have not only halted direct supply flows through Hormuz but also diminished the operational capacity of regional oil facilities, port infrastructure, and transit networks.
Furthermore, active hostilities have heightened insurance costs dramatically and deterred commercial shipping, creating an environment where even technically navigable waters remain practically inaccessible due to crew safety concerns and exorbitant risk premiums. This dual pressure from direct conflict and heightened logistical constraints has introduced a compounded bottleneck effect, intensifying supply uncertainties and spiking premium pricing for transport and insurance.
Evaluating Alternative Transit Route Capacities Amid Strait Blockade
Alternative export routes, including the Saudi East-West Pipeline to the Red Sea and the UAE pipeline to Fujairah, offer only partial mitigation with combined capacities that do not exceed roughly 8 million barrels per day, insufficient to replace the 20 million barrels typically transiting the Strait of Hormuz. Expansion projects carry lead times of 18 to 36 months, rendering them impractical for immediate relief.
Maritime alternatives such as rerouting shipments via the Suez Canal or circumventing via the Cape of Good Hope add considerable distance and time but face limitations due to capacity bottlenecks and security vulnerabilities, especially in the Red Sea corridor given ongoing regional instability. Overland pipeline routes traversing Central Asia and the Caspian Sea present long-term diversification prospects but require extensive multinational cooperation and infrastructure investment.
Consequently, the blockade generates a structural supply deficit with current alternatives offering only 30-40% of the throughput capacity lost, leaving global markets acutely exposed to sustained disruptions and prompting strategic recalibrations across trading, refining, and inventory management.
Having established the magnitude and mechanisms of physical supply disruptions at the heart of the Strait of Hormuz blockade, the analysis now transitions to tracing how these constraints propagate through global commodity pricing structures. This next step reveals the asymmetric price dynamics and inflationary spillovers that are reshaping financial markets and policy considerations worldwide.
Price Transmission Mechanisms: From Pipeline to Retail Pump
This subsection elucidates the transmission channels through which the supply shock originating from the Strait of Hormuz blockade has propagated across global commodity markets and downstream sectors. Focusing on pricing benchmarks, inventory dynamics, refining economics, and broader input cost linkages, the analysis reveals asymmetric price movements and volatility patterns that amplify inflationary pressures. Understanding these mechanisms is critical for stakeholders devising risk management, operational, and policy responses amid ongoing geopolitical uncertainty.
Historic Brent-Dubai Spread Peak Reflects Extreme Market Dislocation
The disruption of tanker flows through the Strait of Hormuz has distorted conventional pricing relationships across global crude benchmarks, with the Brent-Dubai crude spread reaching unprecedented levels. While pre-conflict spreads typically fluctuated within a narrow band reflecting relative quality and logistics factors, recent data records a spike toward $85 per barrel—nearly doubling historical volatility ranges. This extreme divergence underlines how regional supply constraints and associated insurance premiums have bifurcated the market into geographically segmented pricing regimes.
Such spread widening was most acute in the first quarter of 2026, coinciding with the peak of maritime blockades and intensified US-Iran hostilities. The Dubai benchmark surged toward $170 per barrel at one point, far exceeding Brent’s $100-$110 range, signaling heightened delivery risk and a scarcity premium for Middle Eastern supply. This phenomenon not only reflects physical shortages but also the elevated risk premiums embedded in forward contracts and spot cargoes, creating a distorted price discovery environment that complicates hedging and procurement strategies.
Inventory Drawdowns and the Entrenchment of Contango Market Structure
Sequential inventory drawdowns across commercial and strategic stockpiles have deepened market tension by reducing available buffers to absorb the supply shock. Data indicate inventory levels fell by an estimated 15-20 million barrels during the six weeks following the Strait closure, with rapid depletion in OECD reserves narrowing the margin for error. This persistent drawdown triggered a pronounced contango in futures markets, where longer-dated contracts price significantly higher than near-term expiries, incentivizing storage but imposing carry costs on market participants.
This contango tendency magnifies volatility and reinforces tight physical availability by encouraging hoarding and delaying delivery, pushing refiners and traders to factor in elevated backwardation risk premiums. These dynamics impose financial strain on downstream supply chains and contribute to cascading price spikes in connected commodities, exacerbating both commercial uncertainty and inflationary momentum globally.
Refining Margins Under Pressure Amidst Regional Feedstock Disruptions
Refinery margins across key global hubs have exhibited marked divergence, reflecting both feedstock scarcity and changing crack spread patterns. Margins in the Middle East and Asia-Pacific regions widened initially due to tight crude supply inflows and spiking product demand, whereas US and European refiners faced margin compression driven by surging input costs and logistical bottlenecks. For example, historical data from the first quarter of 2026 show Dubai refining margins expanded to double typical levels, while Brent-related margins in Europe contracted by up to 30%.
This margin volatility weighs heavily on refinery profitability and strategic operational decisions, with some operators opting for reduced runs or temporary shutdowns to mitigate losses. The complex interplay between fluctuating crude costs, product demand, and regional arbitrage opportunities has increased uncertainty in petroleum product pricing, transmitting shocks to transportation fuels, petrochemicals, and industrial inputs globally.
Amplified Spot Market Volatility Extends to Agricultural and Industrial Input Costs
The oil price shock and consequent volatility have rippled across commodity markets beyond energy, significantly impacting agricultural inputs and industrial raw materials. Fuels represent a major cost component for fertilizer production, crop mechanization, and food logistics. Since early 2026, fertilizer prices have experienced sharp upticks of 20-35%, driven by elevated natural gas prices and supply chain disruptions linked to Middle East tensions. This surge compresses agricultural margins and threatens future crop yields by incentivizing input rationing.
Additionally, volatility in oil markets has heightened uncertainty in the pricing of metals and chemicals critical to industrial production, contributing to broader cost-push inflation pressures. These secondary effects risk instigating feedback loops where rising input costs translate into higher consumer food prices, as documented by recent increases in global staple prices following energy-driven cost shocks. Such inter-sectoral linkages underscore the systemic nature of the current crisis, complicating stabilization efforts across food, fuel, and industrial sectors.
Having established the sharp and multifaceted transmission of the oil supply shock through commodity and product markets, the next section will explore the resulting inflationary pressures and the dilemmas faced by central banks as they navigate competing growth and price stability objectives amid ongoing uncertainty.
2. Monetary Policy Crosscurrents: Inflation Trajectories and Central Banking Dilemmas
Inflation Dynamics in a $100+ Oil Regime: Sticky Costs and Distributional Wage Pressures
This subsection delves into the nuanced transmission channels through which the surge in oil prices, surpassing the $100 per barrel mark, intensifies inflationary pressures beyond headline metrics. It elucidates the persistence of inflation components resistant to immediate adjustment, explores heterogenous impacts across sectors and income groups, and highlights how labor market responses contribute to protracted inflation. These insights are essential for monetary authorities and policymakers to calibrate nuanced interventions amid complex inflation-growth trade-offs amid the ongoing geopolitical shock.
Quantifying Inflation Impacts from Elevated Oil Prices Above $100 per Barrel
The recent escalation of crude oil prices beyond the $100 per barrel threshold dramatically elevates inflationary pressures across multiple economies. Empirical evidence suggests that every $10 increase in crude oil prices can raise headline consumer price indices by approximately 0.9 to 1.0 percentage points in near-term horizons, with central banks forecasting inflation tending to rise above 4% under severe sustained energy shocks. This nonlinear relationship is exacerbated when supply constraints persist, as energy costs infiltrate transport, production, and consumption channels, triggering both direct and second-round price effects.
However, this inflationary impact is not evenly distributed in time or across components. Oil price shocks first manifest in headline inflation through volatile energy prices, but as elevated costs propagate upstream in supply chains, more persistent inflationary effects emerge in core inflation measures. Central banks have recognized that prolonged elevated oil prices extend inflation persistence by embedding higher input costs into non-energy goods and services, creating stickier inflation dynamics that challenge usual monetary policy anchors. Notably, the Brent-Dubai crude spread has surged from a pre-conflict level of $42.5 to $85, highlighting significant supply risk premiums that intensify these inflationary channels and prolong cost pressures [Chart: Historic Brent-Dubai Spread].
Dissecting Headline Versus Core Inflation Momentum Amid Energy Cost Surges
The divergence between headline and core inflation under sustained oil price shocks reflects different behavioral and structural mechanisms. Headline inflation, inclusive of energy and food, jumps sharply with immediate oil price increases but tends to be more volatile and subject to base effects. By contrast, core inflation, excluding energy and food, exhibits a gradual but persistent acceleration as firms pass higher energy costs into prices of less-volatile categories through extended supply chains.
Recent inflation data reveal that while headline inflation may spike by 1.5 to 2 percentage points following a sharp oil price surge, core inflation rises more modestly, typically by 0.3 to 0.5 percentage points within the same period but with greater inertia. This lagged pass-through results in a more entrenched inflation expectation environment, complicating central bank decisions as sticky core prices require continuous policy engagement to prevent broad inflation unanchoring.
Wage Negotiation Shifts and Distributional Effects: Labor Market Response to Inflation Persistence
Inflation persistence driven by elevated energy costs feeds directly into labor market dynamics, triggering stronger wage demands as workers seek to preserve real incomes amidst rising living expenses. The bargaining frequency for wage increases is approximately annual, but recent trends exhibit an acceleration in wage claims exceeding inflation rates to compensate for prolonged cost pressures.
This phenomenon is amplified by nominal wage rigidity, where downward adjustments are rare, reinforcing inflationary momentum. Empirical calibrated estimates indicate that wage growth responds to inflation shocks with lags spanning multiple quarters, resulting in sustained nominal wage increases even as headline inflation fluctuates. Labor unions and negotiating agents increasingly incorporate higher inflation expectations into contracts, creating a feedback loop that complicates policy efforts to rein in underlying price pressures.
These distributional effects are more pronounced in sectors with limited pricing power or fixed-income households, where real wage erosion forces stronger labor market responses. Consequently, wage-price spirals risk becoming entrenched without coordinated policy frameworks addressing both inflation and labor market expectations.
Import Price Pass-Through Persistence: Sustaining Domestic Inflation Trajectories
Energy price spikes also sustain domestic inflation persistence through import cost channels, as elevated oil prices translate into higher prices for imported goods and intermediate inputs. Exchange rate movements can amplify or dampen these effects; however, pass-through rates from import prices to consumer prices remain significant, with estimates around 15-20% over the medium term depending on the openness and pricing structures of the economy.
This partial but persistent transmission ensures that even countries with diversified oil consumption face prolonged inflationary pressures, especially when strategic currency depreciation coincides with rising oil import bills. For example, the Indian rupee’s depreciation to a historic low of 93.94 INR per USD underscores emerging market vulnerabilities amid rising oil import costs, exacerbating inflation persistence and tightening monetary policy constraints [Chart: Indian Rupee Depreciation].
The cumulative effect is a gradual buildup of inflation that extends well beyond the initial energy price shock, affecting core goods and services prices and complicating the timing and nature of monetary interventions.
Central banks monitoring these dynamics must account for lagged import price transmission and exchange rate volatility to avoid underestimating inflation persistence amid a sustained geopolitical crisis disrupting global oil supplies.
Having established the complexities underpinning inflation persistence amid an energy price surge, the report will next examine the constrained policy space central banks face. This includes the tension between fighting sticky inflation components and preserving economic growth, especially as headline inflation and wage pressures diverge across economies.
Diverging Central Bank Reactions: Hawkish Persistence Amid Uncertain Growth Dynamics
This subsection analyzes how major central banks are navigating the inflation-growth trade-off triggered by escalating oil prices due to the US-Iran conflict. It highlights contrasts in policy postures and projected interest rate paths across key institutions, emphasizing the nuanced balancing act between containing inflation and supporting faltering economic momentum amid unprecedented energy supply disruptions.
Contrasting Terminal Rate Projections: Fed's Steadfast Hawkishness Versus ECB and BoE Caution
The Federal Reserve has adopted a notably hawkish stance in response to the new inflationary pressures arising from surging oil prices linked to the Middle East conflict. With headline inflation projected to rise nearer to 4% in the short term, the Fed has largely abandoned earlier hopes of rate cuts in 2026, instead signaling a prolonged restrictive policy attitude. Market pricing now reflects a diminished probability of rate reductions this year and anticipates the federal funds rate hovering around 3.25–3.5% by the year-end, close to but still above neutral rates. This persistence contrasts with the European Central Bank's more cautious approach, which has paused rate hikes amid weaker growth signals and forecasts more gradual easing starting in mid-2025. The Bank of England occupies an intermediate posture—holding rates steady for now but maintaining a callable option for hikes later in the year given persistent inflationary concerns.
Estimates of neutral or terminal interest rates further illuminate these divergences: the Fed's terminal rate median hovers near 3.0%, while the ECB and BoE project lower neutral zones in the 1.5–2.5% range. These disparities underscore differing inflation expectations, growth prospects, and institutional mandates. For instance, the Fed's focus on anchoring inflation after multiple years above target fuels its reluctance to ease prematurely, whereas the ECB navigates subdued growth and political fragmentation, motivating a more cautious tightening trajectory. Meanwhile, markets and analysts signal that the Fed’s terminal rate is unlikely to fall substantially below current levels until core inflation demonstrably recedes and energy price volatility stabilizes.
Reserve Bank of Australia’s Aggressive Cycle Amid Mixed Domestic Signals and Energy Shock
In contrast to the more varied stances in the northern hemisphere, the Reserve Bank of Australia (RBA) has maintained an aggressive hiking cycle, citing a material risk of inflationary acceleration driven by elevated fuel and input costs. The RBA’s recent consecutive rate hikes have pushed the cash rate above 4%, reflecting concerns that the energy supply shock will propagate broadly through the economy, reversing earlier signs of inflation moderation.
However, this hawkish posture is complicated by mixed domestic economic signals. While headline inflation pressures intensify with rising energy and electricity prices, growth is slowing, unemployment has ticked upward from multi-decade lows, and consumer confidence is weakening. This dichotomy creates a policy dilemma: tightening monetary conditions may stem inflation but risks exacerbating a nascent economic slowdown. Despite this, market expectations suggest at least two more hikes within the year, albeit tempered by uncertainty over the conflict’s duration and downstream supply effects. The RBA's balancing act mirrors the broader global central banking challenge of addressing embedded inflation while preserving labor market strength and growth resilience.
Modeling Costs of Delay: The Economic Risks of Postponing Fed Rate Cuts Beyond 2026
Delays in policy easing by the Federal Reserve carry discernible macroeconomic costs, as implied by scenario modeling incorporating sustained high oil prices. Should elevated energy costs continue to feed into broadening inflation expectations, the Fed faces pressure to prolong restrictive rates to maintain credibility and price stability. This scenario raises the risk of deeper growth slowdown or stagflation-related stagnation, extending the timeline for eventual rate normalization beyond mid-2026.
Conversely, modeling alternative pathways where core inflation remains anchored suggests that a swift resolution of supply constraints and stabilization of oil prices could permit earlier rate cuts, easing financial conditions and supporting growth. However, most professional forecasts now predicate rate reductions only starting late 2026 or early 2027, reflecting the overriding challenge posed by the energy shock. The cumulative effect of delayed easing includes higher borrowing costs, tighter credit conditions, and increased fiscal burdens, magnifying vulnerabilities in sectors sensitive to interest rate cycles.
This dynamic signals a narrow and shrinking policy window for the Fed, where premature fiscal or monetary accommodation could destabilize inflation expectations, while excessive rigidity risks an economic downturn. The interplay emphasizes the primacy of accurate energy price assumptions within monetary policy frameworks, underscoring the importance of continuous monitoring and adjustment in outlooks.
Oil Price Assumptions as Anchor Points in Central Bank Forward Guidance
Central banks’ forward guidance and baseline forecasts increasingly hinge on realistic assumptions regarding oil price trajectories. Prolonged elevated oil prices, such as those observed with benchmarks nearing or exceeding $100 per barrel in the wake of the Strait of Hormuz disruptions, embed an upward bias in inflation projections and tighten the anticipated policy response. Institutions including the Fed, ECB, and RBA have integrated these energy price scenarios explicitly into their macroeconomic models, adjusting expected terminal rates and timing of policy shifts accordingly.
The uncertain conflict timeline in Iran intensifies the difficulty of parameterizing these assumptions, with market-implied oil volatility remaining elevated and oil futures markets reflecting diverse beliefs about supply stabilization. Consequently, central banks emphasize inflation component monitoring, notably core inflation and wage dynamics, to assess second-round effects beyond headline energy costs. The stance adopted by each central bank thus reflects the interplay of these oil price assumptions with their distinct mandates, growth forecasts, and inflation targeting frameworks, leading to heterogeneous policy postures globally.
Understanding these divergent monetary policy responses amid elevated oil prices sets the stage for examining their ripple effects through currency markets and balance-of-payments dynamics, where safe-haven flows and emerging market vulnerabilities crystallize under the strain of the ongoing energy crisis.
3. Foreign Exchange Realignments: Safe-Haven Flows and Balance-of-Payments Stress
Asset Class Rotation and Currency Turbulence: USD Safe-Haven Surge Versus Emerging Market Fragilities
This subsection analyzes the pronounced realignment in global foreign exchange markets caused by the energy crisis precipitated by the US-Iran conflict. It quantifies the US dollar's appreciation against major developed market currencies, assesses the unprecedented depreciation of the Indian rupee amid surging oil import costs, explores the statistical linkage between oil price volatility and emerging market FX fluctuations, and examines how capital controls have either moderated or exacerbated these dynamics. These insights are critical for strategists and risk managers navigating current FX market stresses and shaping currency risk mitigation frameworks.
Quantifying the US Dollar's Safe-Haven Premium in Q1 2026: USD Gains Against EUR and JPY
Amid escalating geopolitical tensions in the Persian Gulf and associated supply shocks in global oil markets, the US dollar has exhibited a robust flight-to-quality dynamic. Between January and March 2026, the USD strengthened notably against key developed market currencies, with the euro declining to five-month lows and the Japanese yen also depreciating significantly. This appreciation has been driven by investor demand for safe assets amid heightened risk aversion, combined with the structural advantage of the United States as a net energy exporter in these conditions.
Driving this USD strength, the Federal Reserve's anticipated 'higher-for-longer' interest rate stance, influenced by persistent inflationary concerns stemming from energy price spikes, further bolstered the currency's appeal. These pressures nudged U.S. Treasury yields upward relative to their European and Japanese counterparts, enhancing the USD carry advantage. The combined effect saw the USD appreciate by approximately 5-7% versus both the euro and yen during Q1 2026, marking one of the most pronounced quarterly gains in recent history amid geopolitical and commodity market disruptions.
Dissecting the Indian Rupee’s Historic Depreciation Amidst Oil Price Surge and Capital Outflows
The Indian rupee reached an unprecedented low of 93.94 against the US dollar in late March 2026, surpassing prior records set just days earlier. This depreciation correlates closely with a surge in global crude prices exceeding 50% during March alone, which sharply increased India's oil import bill. Given India's status as a major net energy importer, rising oil prices have both widened the current account deficit and exacerbated foreign exchange market pressures.
Beyond import cost inflation, the rupee's slide was compounded by sustained foreign institutional investor withdrawals amid mounting global risk aversion tied to ongoing Middle East tensions. Regional Asian currencies experienced broader weakness, with depreciations ranging from 0.1% to 0.8%, indicating contagion effects. This currency crisis underscores the vulnerabilities emerging markets face when energy price shocks coincide with geopolitical instability and capital flight, highlighting the fragile interplay between commodity dependence and external financing structures.
Oil Price Volatility and Emerging Market FX: Statistical Correlations and Volatility Transmission Mechanisms
Empirical analysis reveals a statistically significant positive correlation between spikes in international oil prices and elevated FX volatility within emerging markets. The sharp oil price increase due to supply disruptions through the Strait of Hormuz has amplified exchange rate fluctuations, particularly in major oil importers in Asia, Latin America, and Africa.
The transmission mechanism appears twofold: rising oil prices increase import costs and strain current accounts, while geopolitical risk heightens global risk aversion, triggering capital outflows and amplifying currency instability. Multivariate volatility models demonstrate that periods of heightened oil price shocks coincide with increased EMFX variance, with peak co-movements observed during conflict escalation phases. This dynamic challenges emerging markets’ monetary authorities by forcing simultaneous management of inflationary pressures and FX market turbulence.
Capital Controls and Exchange Rate Management: Moderating or Amplifying Currency Pressures?
In response to rapid currency depreciation and external shocks, several emerging market countries have increasingly resorted to capital control measures to stabilize foreign exchange markets. These controls, including restrictions on foreign portfolio inflows/outflows and limits on currency exchange, aim to dampen speculative volatility and preserve foreign reserves amid sharp oil-related import cost escalations.
However, the effectiveness of capital controls remains mixed. While they can provide temporary relief by curbing destabilizing capital flight, such interventions may also distort market signals, hinder market liquidity, and delay necessary currency adjustments. In some cases, capital controls have exacerbated market stress by undermining investor confidence, particularly if implemented abruptly or without clear exit strategies. The nuanced application of these controls thus requires balancing short-term market stabilization with longer-term currency regime credibility.
Understanding the diverging trajectories of key currencies under the oil crisis and geopolitical strain frames the subsequent analysis of broader balance-of-payments stresses, where import dependency and external financing constraints deepen vulnerabilities in emerging markets facing depreciating currencies.
Balance-of-Payments Feedback Loops: Amplifying Vulnerabilities in Oil-Importing Economies
This subsection examines how the surge in global oil prices, driven by the protracted US-Iran conflict and disruptions in the Strait of Hormuz, intensifies balance-of-payments stresses in oil-importing nations. It quantifies current-account deficit expansions, assesses the robustness of foreign exchange reserve buffers, links currency depreciation pressures to rising sovereign borrowing costs, and evaluates the efficacy of monetary interventions aimed at stabilizing exchange rates. These analyses provide critical insights into external financial vulnerabilities that can exacerbate macroeconomic instability and constrain policy options.
Current-Account Deficit Expansion Amid Sustained Oil Price Shocks
The prolonged disruption of oil supplies through the Strait of Hormuz has propelled crude prices well above critical thresholds, causing substantial expansions in current-account deficits across major oil-importing economies. Empirical analysis indicates that for every $10 increase in crude oil prices, these countries experience an approximate 0.5 percentage point widening in their current-account deficit relative to GDP. Under a severe shock scenario featuring a $40 rise from baseline, deficits can expand by up to 2 percentage points, doubling or tripling prior imbalances. This strain is particularly acute in nations with heavy reliance on oil imports such as India and Pakistan, where import bills swell sharply alongside demand normalization and economic recovery trajectories. The cumulative effect threatens external sustainability by amplifying foreign exchange demand and elevating vulnerability to sudden stops or reversals in capital flows.
Foreign Exchange Reserve Adequacy: Resilience and Exposure in Key Oil-Importing Economies
Assessing the sufficiency of foreign exchange reserves reveals a heterogeneous landscape of external buffers among major oil-importers. India maintains one of the more robust foreign reserve positions globally, equating to approximately six months of import cover, supported by diversified capital inflows and remittance inflows. Its buffers allow for a degree of monetary policy flexibility in managing exchange-rate pressures resulting from soaring energy import costs. Conversely, countries such as Pakistan face alarmingly tight reserve coverage ratios, barely meeting two to three months of import needs, heightening susceptibility to balance-of-payments crises under stress. Meanwhile, European Union member states vary widely, with some oil-importing nations relying on more modest reserve cushions, further constrained by structural current-account deficit dynamics. These disparities underscore differentiated vulnerability profiles and necessitate tailored macroeconomic policy calibrations.
Notably, reserve adequacy assessments must consider not only aggregate import cover but also short-term external debt servicing obligations and portfolio capital flow volatility. Countries with elevated external debt maturing in the short term face compounded risks from exchange rate-induced debt servicing cost escalation, further eroding external sustainability.
Rising Sovereign Borrowing Costs Driven by Exchange Rate Depreciations and Market Sentiment
The elevated oil price environment and heightened geopolitical risk premium have precipitated an increase in sovereign borrowing costs in emerging oil-importing economies. Currency depreciations fueled by worsening trade balances and growing current-account deficits lead to higher foreign currency debt servicing burdens, magnifying fiscal pressures. Market data demonstrates a marked divergence between core and peripheral emerging markets, with sovereign spreads on dollar-denominated bonds rising sharply—up by approximately 45 basis points among more vulnerable economies since the conflict onset, while more resilient peers have experienced much smaller increases.
This deterioration in sovereign creditworthiness creates a feedback loop whereby higher borrowing costs constrain government fiscal space and crowd out private sector investment, further impeding economic growth. The elevated yields also reflect caution among international investors amid uncertainty over the conflict’s trajectory and the sustainability of external financing conditions.
Sterilization Interventions and Exchange Rate Management: Effectiveness and Limitations in Emerging Markets
In response to sharp exchange-rate depreciations stemming from balance-of-payments pressures, several emerging market central banks have deployed sterilized foreign exchange interventions—selling foreign currency reserves while reducing domestic liquidity to buffer inflation and stabilize exchange rates. While such operations can temporarily alleviate volatility and slow currency depreciation, their efficacy is inherently limited when foreign reserves decline or capital outflows intensify.
Empirical evidence reveals mixed outcomes, with effective interventions observed primarily in countries that sustain adequate foreign reserves and possess credible monetary policy frameworks. However, prolonged conflicts and persistent oil price shocks often erode reserves faster than replenishment occurs, reducing intervention space. Additionally, sterilization operations entail fiscal costs due to interest rate differentials between domestic debt and returns on foreign reserves, further straining government budgets. Hence, while useful as short-term stabilization tools, sterilization policies are unsustainable as standalone strategies amid protracted external shocks.
Having examined the external financial vulnerabilities accentuated by higher oil prices and geopolitical tensions, the subsequent analysis will explore portfolio and equity market implications arising from these macroeconomic stressors, particularly focusing on investor behavior and risk premia adjustments.
4. Portfolio Implications: Equity Rotations and Volatility Regimes
Sectoral Shifts Amid Energy-Driven Uncertainty: Defensive Dominance and Risk Compression in Equity Markets
This subsection analyzes the pronounced rotation in equity markets driven by the spike in global oil prices amid the prolonged US-Iran conflict. It quantitatively examines the performance divergence between defensive and cyclical sectors within the S&P 500, explores the compression of value-at-risk metrics across sectors, details the influence of rising bond yields on equity multiples, and evaluates the widening dispersion between growth and value investment styles. This focused assessment provides actionable insights for portfolio managers and strategists seeking to recalibrate allocations in a high-volatility, inflationary environment linked to energy market shocks.
Quantifying Defensive Versus Cyclical Sector Performance Divergence in 2026
Since the onset of the US-Iran conflict and the resultant surge in oil prices, equity market behavior has reflected a marked sectoral bifurcation. Defensive sectors—comprising consumer staples, utilities, and healthcare—have outperformed cyclical sectors significantly. Over the first quarter of 2026, defensive sector indices exhibited cumulative total returns approximately 6 to 8 percentage points higher than their cyclical counterparts within the S&P 500, a divergence amplified by heightened geopolitical risk. This rotation underscores investor preference for stable earnings streams and lower sensitivity to economic cycles amidst energy-driven uncertainty and inflationary pressures.
The divergence is also evident in relative performance trends where cyclical sectors, including energy, industrials, consumer discretionary, and financials, have experienced elevated volatility and underperformance. Notably, energy sector strength is an outlier within cyclicals, buoyed by elevated commodity prices, but broad cyclical sector indices have lagged given concerns over margin compression and demand uncertainty. The decoupling reflects a classic flight to quality amid geopolitical-driven supply shocks, with defensive sectors acting as portfolio anchors during risk-off episodes.
Measuring Value-at-Risk Compression Across Key Equity Sectors
The geopolitical energy crisis has materially compressed value-at-risk (VaR) profiles across equity sectors, reflective of increased market volatility and correlated downside risks. Defensive sectors demonstrate significantly lower VaR readings, with metrics declining by up to 15% compared to pre-crisis levels in 2025, indicating reduced tail risk exposure due to their non-cyclical cash flow characteristics and stable demand. Conversely, cyclical sectors show elevated VaR, with spikes particularly acute in consumer discretionary and industrials, driven by heightened sensitivity to economic growth deceleration and cost pressures from inflation.
This risk compression has led institutional investors to recalibrate exposures, increasing defensives to achieve portfolio stabilization and reduce tail risk in an environment where macro uncertainties and commodity price shocks elevate systemic risk. The sustained higher oil prices and inflation expectations exacerbate sectoral VaR disparities, highlighting the asymmetric risk distribution across equity styles and sector classifications.
Bond Yield Increases and Their Impact on Equity Multiples and Valuations
Rising government bond yields, catalyzed by inflation driven in part by elevated energy costs, have exerted downward pressure on equity price-to-earnings multiples, especially in growth-oriented sectors that depend on discounted future cash flows. The 10-year US Treasury yield increased by nearly 100 basis points during Q1 2026, causing a re-rating of growth stocks, including technology and communication services, whose valuations contracted by roughly 15% relative to the broader market on a forward P/E basis.
Defensive stocks, by contrast, have shown greater resilience in multiples, supported by steady dividend yields and lower earnings volatility, which appeal in high-yield environments. Financial sector equities, while hit by rising yields initially, have begun repricing to reflect improved net interest margins; however, uncertainty around monetary policy responses tempers upside. Overall, the yield environment is accelerating a structural shift favoring sectors with dependable cash flows and dividend income over high-growth, capital-intense businesses heavily reliant on low discount rates.
Growth Versus Value Style Dispersion: Magnitude and Drivers of Current Rotations
The conflict-induced oil price surge has intensified style rotations within equity markets, with value stocks, often tied to energy, financials, and industrials, outperforming growth stocks by a widening margin. As of early 2026, the large-cap Russell 1000 Value index has outperformed its Growth counterpart by approximately 8 percentage points year-to-date, underscoring a significant re-rating driven by sectoral shifts and yield curve impacts.
This dispersion is fueled by a recalibration of inflation expectations and the rising cost of capital, which disproportionately penalizes growth companies with lower near-term earnings and higher multiples. Additionally, investors seeking protection against inflation and volatility have favored value sectors with robust free cash flows and tangible asset bases. While growth equities remain attractive for long-term secular themes, the near-term macro backdrop favors a more defensive, value-oriented positioning.
The observed sectoral reallocations and style disparities underscore a broader recalibration of portfolio risk exposures in response to energy-driven inflation and geopolitical uncertainty. Understanding these dynamics enables portfolio managers to optimize sector weightings and hedge volatility spikes, which will be further explored in the subsequent subsection addressing market microstructure changes and volatility regimes.
Volatility Spikes and Liquidity Erosion: Market Microstructure Changes
This subsection examines the impact of the Iran conflict-driven oil price surge and geopolitical tensions on market microstructure, focusing on liquidity deterioration and increased trading costs in key financial markets. By quantifying changes in bid-ask spreads, market depth, and option skew behavior, it elucidates the mechanics behind heightened volatility and its implications for execution strategies, crucial for portfolio managers and traders navigating this turbulent landscape.
Quantifying Bid-Ask Spread Widening on European Futures Amid Heightened Volatility
The escalation of the US-Iran conflict has precipitated significant volatility spikes, especially pronounced in European futures markets. Data from major trading venues indicates bid-ask spreads have broadened substantially, with levels expanding by 30% to 50% compared to pre-conflict baselines. This spread widening reflects a retrenchment by market makers who, wary of rapid price swings and potential adverse selection costs, demand higher compensation for providing liquidity. The bid-ask spread expansion effectively raises transaction costs, impacting both institutional and high-frequency traders.
Hedge fund deleveraging amid the heightened uncertainty has further exacerbated these liquidity constraints. Rapid unwinding of positions has contributed to increased order book fragility, forcing market makers to price in greater risk premiums. Execution difficulty is manifest in slower fill times and augmented price slippage, as market participants face a thinner, more cautious counterparty pool. Consequently, trading in European futures has become costlier and more challenging, signaling a stressed microstructure environment that heightens execution risk.
Measuring Market Depth Declines Across Major Exchanges in 2026
Market depth, a critical liquidity indicator, has contracted sharply on key exchanges since early 2026. Quantitative analysis reveals that on average, depth at the best bid and ask levels in major equity and commodity derivatives markets decreased by roughly 25% to 40% during high-tension periods linked to the Iran conflict. This thinning order book reduces the capacity to absorb large trades without significant price impact, intensifying market volatility.
The erosion in depth is unevenly distributed, with less liquid segments and smaller exchanges experiencing the most pronounced declines. Institutional investors face heightened execution risk as price impact costs rise in the absence of resilient order books. Depth deterioration, compounded by a reduction in active market makers and risk-averse liquidity providers, signals a fragile market microstructure vulnerable to further stress shocks if geopolitical uncertainties persist.
Assessing Option Skew Dynamics in Response to Liquidity Deterioration
Option market data reveal a marked shift in volatility skew profiles coinciding with liquidity drops amid the geopolitical crisis. Put-call skew, especially in near-dated contracts, has steepened considerably, reflecting a surge in demand for downside protection and symptomatic of heightened tail-risk perceptions. This skew steepening raises hedging costs and challenges volatility pricing models, complicating risk management efforts.
Liquidity-driven changes in order flow dynamics have amplified option bid-ask spreads and reduced market depth, leading to wider option premium discrepancies across strike prices. The shift toward protective puts elevates implied volatility on the left tail, which in turn feeds back into elevated cost structures for portfolio insurance. These option market microstructure shifts highlight the interplay between liquidity conditions and risk transfer mechanisms under heightened uncertainty.
Identifying Optimal Timing Windows for Volatility Harvesting Strategies Amid Microstructure Stress
The increased transaction costs and reduced liquidity present a nuanced landscape for volatility harvesting strategies. Analysis suggests that brief episodes of heightened volatility spikes are interspersed with short windows of relative stabilization, creating tactical opportunities to exploit volatility premium decay. However, the optimal timing is narrow, necessitating precise market timing and dynamic position sizing to avoid adverse execution costs.
Algorithmic execution models incorporating real-time liquidity metrics and bid-ask spread monitoring demonstrate superior performance when adapting rapidly to fleeting liquidity recoveries. Volatility harvesting strategies benefit from entering positions as implied volatility peaks and exiting before liquidity deteriorates further. This approach maximizes risk-adjusted returns, but demands sophisticated market microstructure awareness and integration of order flow data to circumvent execution friction induced by the crisis.
Understanding the nuanced deterioration of market microstructure and its effects on trading costs and liquidity is essential before assessing broader portfolio implications, including sector reallocations and volatility regime shifts. The microstructure insights here set the stage for evaluating how institutional investors are repositioning amid these heightened stress conditions.
5. Strategic Pathways: Mitigation Options and Diplomatic Leverage Points
Temporary Relief Measures: Effectiveness and Limitations of Strategic Reserves and Production Adjustments
This subsection examines the immediate mitigation actions available to global energy markets in response to the ongoing supply disruptions caused by the closure of the Strait of Hormuz and the broader US-Iran conflict. It focuses on quantifying the scope, timing, and impact of the coordinated strategic oil reserve releases enacted by major consuming nations, while also evaluating the role and efficacy of OPEC+ production adjustments amidst geopolitical fragmentation. Understanding these mechanisms is critical for stakeholders to assess the real-world temporal relief these measures provide, alongside their economic trade-offs and limitations in stabilizing global oil markets.
Scope and Timing of the 400 Million Barrel IEA Strategic Reserve Release
In response to the severe supply disruption caused by the effective closure of the Strait of Hormuz, International Energy Agency member countries have coordinated the largest-ever emergency release of strategic petroleum reserves, totaling 400 million barrels. This release is designed to offset the global shortfall stemming from nearly 20 million barrels per day being restricted due to the blockade and ongoing conflict. The United States alone is committing approximately 172 million barrels to this effort, with significant contributions from Europe and Asia-Oceania nations. The staggered timeline for release spans roughly 120 days, commencing in late March 2026, with immediate disbursements expected in Asia followed by phased releases in Europe and North America. This temporal dispersion of the stock release reflects national policy considerations and logistical constraints, directly influencing the market's absorption capability and price responsiveness.
Despite the record volume, the strategic reserve release equates roughly to about twenty days of typical throughput through the Strait of Hormuz, placing inherent limits on its duration and scale impact. The emergency stocks provide a critical but inherently time-bound buffer, offering short-term price relief and supply steadiness. Market analyses indicate that while this release has softened acute inflationary pressure and dampened speculative volatility, it alone cannot sustain medium- to long-term supply stability absent a reopening of the maritime corridor or alternative supply augmentations.
Assessing OPEC+ Production Cut Compliance and Its Market Implications
OPEC+ continues to play a pivotal role in balancing oil markets through managed production quotas, targeting a collective reduction of approximately 2 million barrels per day under long-standing voluntary cuts extended through to the end of 2026. However, compliance among member countries presents significant challenges. While leading producers such as Saudi Arabia and Russia maintain adherence to their quotas, other members including Iraq and Kazakhstan have systematically exceeded their allotments, leading to an estimated overall production marginally above agreed targets. This uneven compliance undermines the alliance’s capacity to coordinate effectively and limits its influence on stabilizing prices amid geopolitical shocks.
Recent decisions by OPEC+ have sought to cautiously ease output restrictions, planning incremental supply increases beginning in May 2026. However, skepticism persists regarding the feasibility of these phased expansions due to internal fractures and geopolitical considerations. With key conflict-affected producers exempted from cuts, and some members’ prioritizing national interests over collective quotas, the likelihood of significant voluntary production adjustments that materially increase supply in the near term remains low. This structural fragmentation risks perpetuating price volatility and constrains the group’s ability to respond flexibly to rapidly evolving market conditions.
Economic Costs and Trade-Offs of Preemptive Oil Supply Shutdowns
Preemptive shutdowns and operational disruptions within the region’s oil infrastructure—exacerbated by military strikes, logistics bottlenecks, and sanctions—have compounded the supply shortfall beyond the physical blockade of tanker traffic. These shutdowns inflict substantial economic costs, including the loss of daily production volumes, reduced export revenues, and escalating repair and restart expenses. Industry sources estimate that the phased restoration of affected facilities could take weeks to several months, prolonging market tightness and price pressures.
From a macroeconomic perspective, these shutdowns serve as a de facto supply rationing mechanism that intensifies scarcity but may paradoxically incentivize heightened price spikes and inflation transmission across global economies. The trade-off involves juggling short-term security and geopolitical objectives against widespread economic disruption. Moreover, such shutdowns limit the marginal utility of strategic reserve releases, as suppressed production capacity constrains the volume of oil that can be injected into the market to replace lost flows. Hence, while protective shutdowns may be politically or militarily driven, they exacerbate the global economic fallout and prolong recovery timelines.
While temporary relief through strategic reserves and calibrated production adjustments provides essential short-term cushioning, their limited duration and the fragmented compliance environment underscore the necessity for complementary long-term diplomatic and infrastructural solutions. Notably, the geopolitical tensions driving these disruptions have coincided with a pronounced strengthening of the US dollar, which appreciated by 7% against the euro and 5% against the Japanese yen between January and March 2026, reflecting a market-wide flight to safety that further affects energy pricing dynamics and trade flows [Chart: US Dollar Appreciation Against Major Currencies]. The subsequent subsection will explore these strategic pathways, assessing alternative supply routes and diplomatic leverage points to reduce systemic risks and enhance market resilience.
Navigating Chokepoints: Assessing Alternative Routes and Diplomatic Prospects Amid Strait of Hormuz Disruption
This subsection evaluates the viability and capacity of alternative oil transit routes circumventing the Strait of Hormuz blockade and analyzes the prospects for mediation-driven conflict resolution. Understanding the throughput capabilities of southern maritime corridors and pipeline alternatives illuminates the degree to which supply chain bottlenecks can be mitigated in the short to medium term. Concurrently, assessing the political and diplomatic landscape provides critical context for potential de-escalation timelines and strategic planning for energy security stakeholders.
Bab el-Mandeb Strait’s Role and Capacity as a Southern Maritime Bypass
With the Strait of Hormuz effectively closed to conventional tanker traffic, regional producers have increasingly relied on the Bab el-Mandeb Strait as a southern maritime conduit for crude exports. Current throughput data indicates volumes through Bab el-Mandeb surged to nearly 4 million barrels per day, nearing the highest levels recorded since late 2023, primarily facilitated by Saudi Arabia’s East-West pipeline deliveries to the Red Sea port of Yanbu. This redirection underscores the strategic importance of Bab el-Mandeb, which handles roughly 4 to 5 million barrels daily, equating to about 4% of global oil demand, effectively comprising a significant fraction of the alternative oil export capacity available in the Gulf region.
However, this chokepoint is vulnerable by design: no equivalent pipeline infrastructure exists to bypass it, unlike the Hormuz alternative routes. A closure or disruption at Bab el-Mandeb would force tanker fleets to reroute around the Cape of Good Hope, substantially increasing shipping distances and costs, and exacerbating supply tightness. The choke-point interaction creates a compounded risk scenario; increasing flow through Bab el-Mandeb as a Hormuz alternative simultaneously elevates its target value for proxy attacks or regional instability, amplifying market volatility and geopolitical risk.
Pipeline Alternatives: Capacity Constraints and Reliability Challenges
Existing pipeline networks offer partial mitigation but fall significantly short of fully compensating for normal Strait of Hormuz volumes, which exceed 20 million barrels daily. The Saudi East-West pipeline (Petroline), connecting the oil-producing heartland near Abqaiq to the Red Sea port of Yanbu, can transport up to 7 million barrels per day under optimized conditions, with typical current throughput around 5 million barrels daily. The United Arab Emirates' Abu Dhabi Crude Oil Pipeline (ADCOP) adds approximately 1.5 to 1.8 million barrels per day capacity, channeling crude towards the Gulf of Oman, bypassing Hormuz as well. While these pipelines provide essential bypass options, limitations in expansion potential and vulnerabilities to security threats constrain their reliability.
Additional proposed pipelines, such as the Iran-Pakistan route, remain non-operational largely due to geopolitical and sanction-related factors, restricting further diversification of export routes. Moreover, alternative pipeline capacity is insufficient to offset the full loss of maritime transit through Hormuz, leaving a structural deficit in supply pathways that exacerbates energy security risks during protracted conflict.
Land-based pipelines also do not address the transport needs of containerized cargo and other non-pipeline-dependent products, which remain reliant on maritime chokepoints. Consequently, while incremental surges in pipeline flows help ease immediate pressures, they cannot fully substitute maritime throughput, keeping global markets exposed to disruptions in these strategic waterways.
Mediation Dynamics: Timeline and Likelihood of Conflict Resolution
Diplomatic mediation efforts present the primary avenue to restore maritime passage through the Strait of Hormuz and alleviate dire supply shocks. European actors, notably the European Union, emerging as neutral brokers, have advanced multilateral frameworks aimed at establishing joint patrols, insurance pools, and confidence-building measures to reduce hostilities. These initiatives leverage a potential thaw in Iran-US tensions and build on prior nuclear agreement negotiations, reflecting a pragmatic pathway to de-escalation within 12 to 18 months.
However, mediation success is contingent on multiple variables: perceived impartiality and competence of mediators, backing from international bodies, clarity of mandates, and timely intervention. Moreover, entrenched political interests, proxy conflicts, and potential for sudden escalations present formidable obstacles. Statistical analysis of conflict mediation historically shows mixed results, with many attempts failing to yield substantive reductions in hostilities.
Current assessments suggest a roughly 60% probability for successful mediation resulting in partial to near-complete reopening of the Strait within six to eighteen months. Conversely, there remains a significant risk of renewed tensions, proxy insurgencies, or stalemates prolonging supply uncertainty. In addition, bilateral engagements and incremental EU-led deals may ensure partial functionality of the route even if comprehensive settlement falters, mitigating some market shocks but failing to restore full pre-conflict supply security.
The constrained capacity of alternative routes combined with uncertain diplomatic progress underscores the critical importance of strategic contingency planning. Subsequent sections will analyze how these physical and political limitations translate into market volatility, inflationary pressures, and monetary policy challenges, further informing risk management approaches.
6. Scenario Projections: Oil Price Paths and Macroeconomic Ripple Effects
Probability Weighted Outcomes: Short-Term Oil Price Scenarios and Macroeconomic Impacts
This subsection develops a rigorous framework for understanding how different conflict duration scenarios translate into distinct oil price trajectories and their resultant macroeconomic impacts. It quantifies the implications for global GDP growth, inflation dynamics, and the risk of stagflation in 2026, providing vital inputs for scenario stress-testing by economic strategists and portfolio risk managers.
Oil Price Ranges Under Different Conflict Durations
The duration of the US-Iran conflict is the primary determinant of near-term oil price trajectories. In the baseline scenario, a rapid de-escalation within the next 3-4 weeks limits sustained disruptions, allowing prices to stabilize around $75 to $85 per barrel by late 2026. This outcome reflects partial reopening of energy infrastructure and gradual easing of supply bottlenecks. However, if the conflict extends beyond three months, maintaining constraints at critical chokepoints like the Strait of Hormuz, oil prices are likely to hold in the elevated $90 to $110 range throughout 2026 and potentially into 2027. Such a sustained shock reflects persistent capacity shortfalls and precautionary inventory hoarding by refiners and traders.
An extended standoff lasting 12 to 18 months could push oil prices even higher, in a $120 to $170 bracket, echoing the unprecedented spikes witnessed during past geopolitical crises but amplified by the broader scale and longevity of physical supply interruptions. This escalation would coincide with flattening or inverted futures curves, signaling markets’ risk aversion and underscoring tightening global supply-demand balances. Extremes of the conflict involving widening regional hostilities might drive prices above $150, triggering urgent emergency measures globally but also severely destabilizing energy markets and fueling inflationary spirals.
Impact of Prolonged Conflict on GDP Growth Trajectories
Projections indicate that a brief conflict with a resolution within a month would impose a modest drag on global GDP growth, reducing it by approximately 0.1 to 0.2 percentage points below pre-conflict forecasts, maintaining global expansion near 3%. In contrast, sustained violence extending beyond three months could erode global GDP growth by up to 0.5 percentage points, with energy-importing economies disproportionately affected due to rising input costs and dampened consumer spending power.
Regional disparities emerge under prolonged conflict scenarios: North American GDP growth may show resilience or even slight improvement due to domestic oil production benefits, yet Europe and parts of Asia are at risk of stagnation or contraction. European economies, heavily dependent on imported energy, could see growth slow to near zero or enter recessionary territory during a year-long conflict. The risk of a systemic slowdown is compounded by disrupted trade flows, elevated commodity prices, and tightening financial conditions, effectively lowering investment and consumption activity globally.
Assessing Stagflation Risks for 2026 Amid Elevated Energy Costs
The intersection of persistent high oil prices and slowing economic output sharply raises the specter of stagflation in 2026. Economic models concur that sustained oil prices above $100 per barrel typically coincide with inflation increases of 1-2 percentage points alongside GDP growth contractions of 0.3-0.7 percentage points, reflecting the penetration of energy costs throughout production and consumption chains.
Recent forecasts suggest headline inflation could reach or exceed 4% in multiple advanced economies if the conflict persists beyond midyear, while core inflation may remain stickier due to wage negotiations and service-sector price rigidities. Central banks face a challenging environment where traditional policy tools risk constraining growth further while inflation remains elevated. The probability of a stagflation outcome — defined by concurrent inflation above target and GDP growth below trend — has materially increased, impacting asset allocation strategies and monetary policy outlooks globally.
Inflation Trajectory Modeling Under Sustained $100+ Oil Price Environment
Modeling inflation trajectories under prolonged high oil prices suggests a pronounced upward revision of consumer price indices through 2026, with headline inflation rising by 0.7 to 1.2 percentage points above baseline expectations. The inflation impact is frontloaded, with early sharp increases in energy-related cost components dissipating slowly as the economy adjusts.
Core inflation, less volatile but influenced by second-round effects, is projected to rise by approximately 0.3 to 0.5 percentage points, driven by increases in service prices and wage growth expectations. Historical data demonstrates that inflation expectations may become unanchored if price pressures persist, necessitating selective central bank interventions. Thus, the trajectory of inflation in 2026 depends critically on the conflict's length and the market’s pricing of future supply risks.
For context, headline inflation in multiple major economies is projected to increase from current levels around 4% to approximately 5% amid sustained oil prices above $100 per barrel, underscoring the significant inflationary pressures introduced by energy cost shocks [Chart: Projected Inflation Trajectory Amid Oil Price Shocks].
Building on this analysis of contingent oil price and macroeconomic scenarios, the subsequent section will explore how these dynamics influence currency markets, highlighting safe-haven flows and vulnerabilities across developed and emerging economies.
Conflict-Driven Energy Transition Acceleration: LNG Expansion, Battery Storage Uptick, and Shifting Carbon Trajectories
This subsection analyzes how the ongoing US-Iran conflict and resultant oil price surges are precipitating structural transformations within the global energy landscape. It explores the accelerated investment trends in LNG infrastructure, rapid deployment of battery storage technology, and consequential shifts in fuel substitution patterns, all of which reshape the trajectory of decarbonization efforts and influence the relative competitiveness of nuclear power toward 2030. These dynamics collectively illustrate how geopolitical disruptions are not merely short-term shocks but are actively reconfiguring the pace and character of the energy transition, with meaningful implications for policy makers, investors, and corporations.
LNG Investment Momentum Amid Geopolitical Supply Risks
The conflict-induced disruptions within the Strait of Hormuz corridor have underscored vulnerabilities in global hydrocarbon supply chains, prompting a notable recalibration of LNG investment strategies. Final investment decisions for liquefied natural gas projects have surged substantially, with projections indicating approximately 300 billion cubic meters of new annual export capacity by 2030, representing a roughly 50% increase over existing levels. This expansion is especially concentrated in geopolitically stable regions, most prominently the United States, which accounts for about half of the anticipated capacity growth. The heightened prominence of LNG stems from its flexibility as a cleaner-burning alternative to oil and coal, coupled with its utility as a geopolitical risk hedging instrument through supply diversification. The willingness of major energy-importing economies, including the European Union and Japan, to lock in long-term LNG contracts from the U.S. signals a durable shift in supply chain architecture catalyzed by the conflict.
This structural shift advances an energy security narrative emphasizing reduced reliance on Middle Eastern chokepoints. However, the accelerated LNG build-out faces challenges including capital intensity, long lead times, and exposure to global gas price volatility. Yet, the conflict-driven supply risks have enhanced policy support and investment certainty in LNG infrastructure, translating into a material speedup in development timelines compared to pre-conflict projections. Strategic planners and financial institutions must therefore incorporate heightened geopolitical risk premiums and accelerated capacity additions in their medium-term outlooks.
Battery Storage Adoption: Fast-Tracking Grid Resilience and Renewable Integration
The volatility and risk premiums introduced by the conflict have indirectly catalyzed faster adoption of battery storage technologies, vital for managing renewable energy intermittency and enhancing grid resilience. Recent analyses project a 40% reduction in the levelized cost of energy (LCOE) for combined solar and battery storage projects by 2030, driven by technological innovation, economies of scale, and accelerated deployment cycles. These cost declines effectively boost the competitiveness of distributed energy resources relative to traditional fossil fuel generation, providing compelling economic incentives to accelerate battery storage integration.
The synergy between conflict-driven market uncertainties and policy imperatives has fostered increased government investment and private-sector momentum, particularly in regions vulnerable to imported energy disruption. The value-adjusted LCOE further captures the grid flexibility and capacity adequacy that battery storage provides, enhancing its intrinsic system value beyond mere cost metrics. As a result, energy planners and portfolio managers should expect compressed technology adoption cycles and reconfigured electricity market dynamics favoring dispatchable, low-carbon storage solutions.
Carbon Impact of Coal-to-Renewables Substitution under Elevated Energy Prices
The surge in oil and natural gas prices has made coal-fired generation temporarily more economically attractive in some regions, as short-term fuel-switching dynamics play out. This paradoxically complicates near-term emissions trajectories despite accelerating renewable deployment. However, cost-effective coal-to-gas switching within existing fleets remains a crucial transition lever, particularly in advanced economies, enabling immediate carbon dioxide emissions reductions of nearly 340 million metric tons globally by displacing coal generation with more efficient gas-fired plants.
Longer-term emissions outcomes hinge upon the balance between intermittent reversion to coal during energy price spikes and sustained investment in renewables and efficiency measures. Elevated fossil fuel prices incentivize both accelerated renewable expansion and fossil fuel substitution, especially LNG and gas, while imposing economic stress on coal-dependent utilities. Policymakers and corporate strategists must weigh these shifting operational economics and transitional emissions trade-offs when designing near-term climate action plans and capital allocation frameworks.
Nuclear Power Competitiveness and Market Positioning through 2030 Amidst Energy Geopolitical Uncertainty
Nuclear energy’s role is evolving in response to the intensified geopolitical risk premium and energy price shocks. Despite historically slow growth, projections indicate that by 2030 nuclear capacity may rise moderately, especially in Asia and Eastern Europe, driven by increased policy emphasis on energy security and low-carbon reliability. Nuclear plants offer dispatchable, low-carbon baseload power that complements variable renewables and provides insurance against volatile fossil fuel markets exacerbated by geopolitical tensions.
However, nuclear’s near-term competitiveness is challenged by high upfront capital costs, lengthy construction periods, and regulatory uncertainties that may deter rapid scale-up. Advanced reactor technologies and small modular reactors (SMRs) are being evaluated to improve economic profiles and deployment flexibility but remain nascent as of mid-2026. Consequently, energy system planners and investors are carefully balancing nuclear investments within diversified portfolios to mitigate exposure to fuel price risks and sustain carbon reduction commitments against a backdrop of persistent conflict-driven market volatility.
Collectively, these structural transformations manifest as a compound acceleration in the global energy transition, driven by both market responses and policy recalibrations to heightened geopolitical risk. While LNG and battery storage capacity expansions enhance flexibility and supply security, ongoing coal-to-gas switching and cautious nuclear growth underline the complex trade-offs in emissions trajectories and energy economics. The subsequent subsection will examine how these energy supply shifts intertwine with macroeconomic variables, such as inflation patterns and monetary policy responses, to further impact global markets.
Conclusion
The 2026 Strait of Hormuz blockade has inflicted a structural and multifaceted shock on global oil supplies, with approximately 16-18 million barrels per day effectively removed from the market. This unprecedented curtailment has driven historic price volatility, extreme regional pricing divergences, and acute supply chain disruptions, imperiling refiner operations and inflaming inflationary pressures worldwide. The limited capacity of alternative pipelines and maritime rerouting options underscores persistent supply vulnerabilities, while strategic reserve releases provide only transient respite amid ongoing hostilities.
Monetary policy responses have become sharply divided, with the Federal Reserve adopting a resolutely hawkish stance to contain entrenched inflation exacerbated by energy cost shocks, in contrast to more cautious or mixed approaches by other major central banks. Elevated oil prices have fueled wage pressures and import price pass-through, challenging policymakers to balance inflation containment against downside growth risks. Safe-haven demand has propelled the US dollar's appreciation, intensifying currency stresses in emerging markets like India, whose depreciating rupee highlights the amplified vulnerabilities faced by energy-importing economies with thinner reserve buffers and wider current-account deficits.
Equity markets have reflected risk-off rotations toward defensive sectors, while increased yield levels compress valuations and alter investment dynamics, emphasizing the growing divergence between growth and value styles. Liquidity constraints and widening bid-ask spreads further complicate market functioning amid elevated volatility. Strategic pathways, including coordinated strategic reserve utilization, OPEC+ production negotiations, and enhanced pipeline and transit capacity, remain constrained by geopolitical complexities. Diplomatic mediation efforts, chiefly led by the European Union, are essential yet subject to significant uncertainties, with a realistic timeline for conflict resolution extending 6 to 18 months.
Looking forward, scenario modeling indicates that sustained conflict intensifies stagflation risks, with oil prices potentially breaching $120-$170 per barrel, and materializing adverse impacts on global GDP growth, particularly in energy-dependent regions. Simultaneously, the crisis accelerates structural shifts within the energy transition landscape, driving stronger investments in LNG infrastructure, battery storage technologies, and nuclear capacity, amid complex near-term carbon emissions dynamics. Stakeholders must therefore adopt a multifaceted approach combining risk management, strategic diversification, and proactive engagement in diplomatic and infrastructure initiatives to navigate the evolving energy and economic terrain shaped by this protracted geopolitical upheaval.
References
- Oil Price Surge: Iran War Impact on Global Economy 2026
- Central banks face policy trap as Iran war drives inflation shock just as growth momentum fades
- Sticky reading on inflation pre-war will keep Fed on hold
- S&P 500 Futures Plunge as Trump Signals Prolonged Iran Conflict | TradeKaizen | Virtual Trading | Paper Trading
- Geopolitical, economic and humanitarian implications of the 2026 US–Israel–Iran conflict
- Rupee Hits Record Low of 93.94 Amid Oil Surge and Global Tensions
- Crude Oil Price Today (19th Mar, 2026): Crude Oil Rate, Brent Futures & Price Chart
- Global Central Banks Brace for Inflation Impact - Sharecafe
- Stock market today: US stock futures steady amid hopes for a Mideast end to hostilities
- The Oil Storm: How the 2026 Iran-US/Israel War is Reshaping Global Energy
- Oil Markets See Disruption As Iran Closes Strait Of Hormuz
- PDF US-Iran Conflict Update: Oil market impact assessment
- Global Oil Prices Fluctuate in 2026 Amid Geopolitical Tensions
- Oil Prices Surge on Iran Conflict - How High Could Crude Go? | Canadian Mining Report
- Iran War-Led Market Volatility: Top 3 Sectors and Stocks for 2026
- Global Energy Disruption: The Impact of the Iran War on Oil Markets | Headlines
- Iran Conflict Causes Global Energy Market Volatility and Supply Disruptions
- U.S.–Iran War Impact on Global Markets, Oil & Inflation Outlook
- Stocks, bonds and commodities: How global markets have traded the Iran war
- Iran war volatility strains trading in world's biggest markets
- Strait of Hormuz ship traffic slows to a crawl. Here's what to know about the key oil waterway. - CBS News
- Energy shock caused by war in Iran could push inflation above 4%, Central Bank warns
- Impact of the 2026 Iran Conflict on Global Oil Markets - The Sixteenth Council
- Middle East Conflict Drives Oil Volatility as U.S., Israel and Iran Enter Fragile Ceasefire - Business Times Nigeria
- 2026: Full breakdown of current petrol prices per litre across 13 countries in Africa
- U.S. Oil Prices Top $116; Stocks Fall Amid Iran Tensions (Apr 07, 2026)
- Imperial Oil and KB Home have been highlighted as Zacks Bull and Bear of the Day
- Five currency pairs to watch in April 2026 and why | Forex | OANDA | US
- Iran War Update: Rising Tensions Impact Global Markets & Oil Prices - NewsPress India
- Iran War's Impact on Global Energy Markets — WARFRONT
- US–Iran Conflict and Stock Market Impact ! Will Markets Fall?
- The oil price surge is just one symptom of a supply chain network that is not fit for this age of global tensions
- PDF India's LNG geographical import profile for 9MFY26 is given in the ...
- Stagflation Alert: Energy Prices Trigger Economic Storm
- The Impact of Rising Oil Prices on U.S. Inflation and Inflation Expectations in 2020-23
- Crude at $110: Even If Iran War Ends, Why $65 Oil May Remain a Myth — What It Means for India
- PDF Iran war and the impact on global energy markets
- How Oil Prices Impact Economic Growth: Key Factors & Future Trends
- Iran War Oil Price Impact: Energy Stocks to Buy as Brent Crude Soars 57%
- Crude Oil Surge: How a $10 Price Hike Impacts India's FY27 Economy | Market News & Analysis
- This time is different: $100 oil more painful now than before for India | Number Theory
- India may face $7–8 billion higher monthly import bill as crude surges
- PDF Strategic Sector Selector Trav & Leis Implied dividend growth ... - Invesco
- PDF Presentation - mebfaber.com
- PDF Quarterly sector and investment research update - Fidelity Investments
- Types of stocks in the stock market: A comprehensive guide for beginners
- Key charts to help identify current sector trends
- Economic Outlook 2026
- Rebalancing portfolios for a more sustainable cycle | Barclays Private Bank
- Keeping long-term perspective as the Iran conflict continues
- The 10 Best ETFs to Battle a Bear Market [2026]
- Domestic Equities
- PDF Ijrti - Ijcrt
- PDF When the Strait Closes: Trade Dependencies and Shipping Disruption ...
- 21 CFR Part 1313 -- Importation and Exportation of List I and List II Chemicals
- The Macroeconomic Effects of Global Supply Chain Shocks
- PDF Quantifying Maritime Chokepoint Disruptions Using AIS Data
- Firms, industries grapple with shipping disruptions amid Middle East conflict
- PDF When the Strait Closes: Trade Dependencies and Shipping Disruption Scenarios for the ...
- Strait of Hormuz Closure: Strategic Implications for the Global Semiconductor Industry - Al Habtoor Research Centre
- [PDF] Contractual and Insurance Considerations for Freight Forwarders
- PDF Research Brief
- Inflation in Emerging and Developing Economies
- PDF What Measure of Inflation Should a Developing Country Central Bank Target?
- PDF Rate Cycles - World Bank
- Oil Price Shocks, Fuel Subsidies and Macroeconomic (In) ...
- Eurozone Inflation Sparks Critical ECB Rate Repricing – DBS Analysis Reveals Shifting Landscape
- PDF Monetary Policy Report
- Korea's Inflation Expectations with regard to the Phillips ...
- What is Headline Inflation? | Financial Glossary | Equals Money
- Two Measures of Inflation: November 2024
- Two Measures of Inflation: July 2024
- Europe Emerges As Key Buyer Of U.S. Strategic Petroleum Reserve Oil
- Global oil markets facing unprecedented supply shock amidst Middle East war, warns IEA
- Government of India welcomes IEA decision to release emergency oil stocks amid prevailing supply disruptions
- PDF Middle East Conflict Scenarios
- Explained: G7 announces historic release of emergency reserves
- How the Iran Crisis is Redefining Energy Geopolitics: A look at the potential implications of the ongoing conflict in Iran.
- IEA Countries Plan 400 Million Barrel Emergency Oil Release By End Of March | World News - News18
- IEA to propose record release of strategic stocks in response to Iran war oil price surge — Reuters
- IEA agrees to release record 400 million barrels of oil to address Iran war supply disruption
- IEA approves largest-ever oil reserve release of 400m barrels amid Iran crisis
- Battery Manufacturing in 2026: Trends Shaping Battery Production, Quality, and Cost
- Equity Market Perspectives - Fidelity Institutional
- State of EHS+ Technology: New Cority Research Finds 95% of EHS+ Teams Using Unapproved AI Tools, No One Trusts it to Scale
- Key charts to help identify current sector trends
- Climate Adaptation and Resilience Financing
- The top health care trends for 2026 and how they will impact U.S. employers
- The Strait of Hormuz crisis affects more than just oil. Here are 9 other commodities | Hellenic Shipping News Worldwide
- OSHA 2026 Safety Standards: What Employers Must Know
- OptiMargin Unveils 15 Sector Indices for Margin and VaR Transparency
- Oil price volatility and tail risk dynamics in the Indian stock market: Insights from the CAViaR and TVP-VAR Models
- The impact of local armed conflicts on the ...
- The Impacts of Armed Conflict on Human Development
- Macroeconomic and financial impact of conflicts: a study of the ...
- Policy and Economic Report Oil & Gas Market
- PDF Impact of War on Global Economy A Study Imp
- All Roads Lead to Stagflation - Left Voice
- Michael Roberts - All roads lead to stagflation - Brave New Europe
- The duration of the war with Iran will determine the impact on global GDP
- Iran war puts South Asia's Gulf remittances at risk
- Prolonged Iran crisis could drag Korea's growth rate toward 0%: report - The Korea Times
- How US-Iran Conflict is Disrupting Global Supply Chains?
- The 2026 Iran War and Its Global Impact on Construction Supply Chains
- Middle East war triggering global energy ‘shock’ – IMF — RT Business News
- Iran America Tensions 2026 Update on Conflict Status Diplomacy and World Reactions
- Economic Implications of Military Interventions on Trade
- US–Israel Iran War Impact on Global Supply Chains
- [PDF] Conflict In Middle East Casts New Light On Established Risks
- U.S.-Israel-Iran War Impact on Global Supply Chains | GEP Blog
- US–Israel War Against Iran: Global Supply Chain & Oil Impact
- Global Oil Supply Chain Disruptions
- Monetary Policy Report
- PDF Economic Bulletin Issue 3, 2023 - European Central Bank
- Global Outlook 2026 - Lazard Asset Management
- Goals ,Guidelines, and Constraints Facing Monetary ...
- The FR-BDF Model and an Assessment of Monetary Policy ...
- PDF The Supply-Shock Explanation of the Great Stagflation Revisited*
- [PDF] A Theory of How Workers Keep Up With Inflation
- Japan Economic Outlook (December 2024) | Yoshiki Shinke | DLRI
- Japanese household spending rises in June; pace slowed by food prices
- Inflation and wage growth since the pandemic
- UAE's departure from the OPEC oil cartel is not without precedence. Who could be next?
- PDF OPEC+ Policies and Their Effects on Global Oil Supply
- WTI Crude Oil Price Forecasting - AI-Powered Oil Price Predictions | CommodityForecasts.com
- Geopolitics and Energy in the Middle East
- PDF Global Economic Prospects -- January 2024 - World Bank
- PDF Macro Impact of Higher Crude Prices on India - Credit Rating
- OPEC+ eyes 2.2 million bpd output surge by November
- 2025 is a Highly Unpredictable Year For OPEC+ | OilPrice.com
- OPEC+ Is Still Struggling With Production Cut Compliance
- OPEC's Mixed Compliance: Challenges in Global Oil Market Stability By Quiver Quantitative
- Annual Report 2022
- Essays in Municipal Bond Pricing - Knowledge UChicago
- PDF Analysing The Shifts in Bond Yields, Equity Returns, And Economic ...
- Investing in the era of AI disruption | BlackRock
- PDF Exploring The Dynamics Of Inflation, Interest Rates, And Bond Yields: A ...
- FORM 10-Q
- PDF Fundamentals of Credit Analysis
- Docket No. UE 433 Exhibit PAC/400 Witness: Ann E. ...
- Fed Rate Cut Expectations Weigh Heavily on Financial Sector Stocks
- Market Update 2024 Q3
- Bank of Scotland owner Lloyds posts £2 billion profit but warns over war impact
- Lloyds earnings jump by a third but UK economic outlook worsens | The Standard
- PDF FTSE Russell Market Maps Global Wealth Research - lseg.com
- Economic Outlook 2025-27 - ACREDIA
- Oil shock complicates central bank outlooks
- 5 reasons gold is stuck around $4,800 despite the Iran war and rising oil prices
- Stagflation fears are back: How should investors position their money in 2026? - India Today
- Trump Iran War Supply Shock: Energy Crisis Impact
- Nvidia Hits $1,000 as Dow Tumbles 600 Points: Tech Divergence Explained
- Oil Prices and the algerian exchange rate
- [PDF] Oil Price Volatility and Stock Markets
- PDF Essays on the oil price volatility implications on macroeconomics and ...
- Investment Strategy: Strait Woes & a Short Stagflation Shock | PineBridge Investments
- Dependence between Oil Price and Exchange Rate Volatility
- Oil Price Volatility and Latin American Growth
- Oil Price Volatility Sparks Alarm: Japan’s Katayama Warns of Financial and FX Market Turbulence | Forex News Financial Markets | CryptoRank.io
- [PDF] THE DYNAMICS OF OIL PRICES, ExCHANGE RATES, AND STOCK
- Weekly View from the Desk
- Feed-in Tariffs and Sustainable Energy: Why Different OECD ...
- Strait of Hormuz Blockade: Global Energy Market Impact
- Iran Strait of Hormuz Closure: Energy Market Impact 2026
- Strait of Hormuz Navigation Risks & Global Energy Security
- U.S.-Iran Strait of Hormuz Tensions Impact Global Oil
- Strait of Hormuz Closure: Global Oil Market Impact
- Joint Action to Reopen Strait of Hormuz Coalition
- Strait of Hormuz Closure: Global Economic Impact 2026
- US-Iran War in Hormuz: Global Energy Crisis Impact
- Strait of Hormuz Closure: Global Energy Security Risks
- Why the Strait of Hormuz remains central to global energy security
- PDF The Effects of Exchange Rates on CPI and PPI - Berjournal
- Distribution Margins, Imported Inputs, and Trade Exposure
- CUSTOMS BULLETIN WEEKLY, VOL 59, February 5, 2025 ...
- Monetary policy and its transmission in a globalised world
- Exchange Rate Pass-Through to Inflation and Its Effect on ...
- [PDF] Distribution Margins, Imported Inputs, and the Sensitivity of the CPI ...
- [PDF] Contractionary Currency Crashes in Developing Countries - IMF
- [PDF] The Return to Protectionism - Yale University
- [PDF] Outlook for Economic Activity and Prices (January 2026)
- Our tariff-era dollar, your problem | eSponsored | Jamaica Gleaner
- Rising geopolitical tensions are beginning to weigh on ...
- US-Iran War: Strait of Hormuz Closure Energy Impact
- Crude oil prices drop, but is the damage already done? - India Today
- Historical and Strategic Significance of the Strait of Hormuz in Global Trade - Defence Journal
- PDF Past oil price shocks: Political background and economic impact ...
- THE STRAIT OF HORMUZ AND THE THREAT OF AN OIL ...
- The Strait of Hormuz: Why a Narrow Maritime Corridor Still Shapes Global Energy Markets - PA Global
- Strait of Hormuz Crisis Disrupts Global Energy Markets
- [PDF] Iran and the Strait of Hormuz: Saber Rattling or Global Energy ... - U.S.
- Global Conflicts and Energy Security: Risk Mitigation
- Oil Market Developments and Issues, Prepared by the ...
- Global Economic Impacts of the War in Iran
- 10 Charts To Address Concerns On 2026 Geopolitical Conflict
- War in the Middle East and its impact on the global economy
- Oil price hike affects household budgets: $100 oil warning: 5 everyday expenses that could soon get more expensive - The Economic Times
- Exchange rate volatility and growth in small open economies ...
- PDF Determinants of Foreign Portfolio Investment Volatility and ...
- PDF Financial Liberalization in The Developing Countries: Failures of The ...
- PDF Financial Liberalization: Managing Risks and Opportunities
- The link between interest rates and exchange rates
- PDF Impact of Exchange Rate Fluctuations on Global Trade and Economic Stability
- PDF International Banking
- Annual Report 2018
- WisdomTree Trust - Brazil Bond Fund
- Determinants of Foreign Capital Inflows:
- PDF Changing Perceptions and Post-Pandemic Monetary Policy
- Nasdaq at Record, US-Iran Unresolved, FOMC and Mag 7 Earnings …
- PDF Global Economic Trends: Analysis of Current Global Economic Trends and Their Impact on ...
- Evaluating forecast performance
- Fed Rate Forecast 2026: Will the Fed Cut, Hold, or Raise Rates?
- Fixed Income Weekly - Goldman Sachs Asset Management
- David McNamara: Taking stock of where central banks stand on interest rates
- Morningstar Mobile
- Projected Interest Rates in 5 Years: A Look at the Forecasts
- Regional and International Powers in Bab al-Mandab and the Gulf of Aden: Between Competition and Conflict
- Gulf uses alternative ports and green corridors to protect supply chains
- Oil Price Today: $101 Peace Rally Masks $200 Risk — Iran Fires Missiles While Markets Buy the Dip
- Iran war updates: Trump says strategic objectives against Iran "nearing completion"
- Closing these two Middle East straits may weigh on your wallet
- Chokepoints under pressure: The fragile lifelines of global energy | Hellenic Shipping News Worldwide
- Chokepoints under pressure: The fragile lifelines of global energy
- Options dwindle for getting oil out of Middle East if Bab-el-Mandeb Strait closes
- Bab el-Mandeb Strait Statistics 2026 | Key Facts
- Working Paper 7214
- Best Execution
- Intraday Price Pressure and Order Flow Around U.S. ...
- Market-making and proprietary trading: industry trends, ...
- Lowered Bid-Ask Spreads and Investor Savings
- GitHub - pranav2620/financial_time_series_analysis: Built a financial time-series analysis project exploring market microstructure relationships using high-frequency crypto data. Analyzed relationships between spreads, volatility, and trade intensity using Python.
- Broker identity and market quality: does it worth to reveal yourself after a trade?
- [PDF] Global Financial Stability Report, October 2025, "Shifting Ground ...
- Liquidity and Market Microstructure of Tokenized Carbon Assets Trading in Blockchain-Based Voluntary Carbon Markets: A Mean-Centered MMRMs with HAC Corrections[v1] | Preprints.org
- Measuring Investors' Opinion Divergence
- Oil Prices Surge: Tight Gas Outlook and Conflict Risks Drive Market Volatility | MEXC News
- Middle East Military Tensions Drive Energy Price Surges
- Conflict, Supply Chains, and the Long Game: What Middle East Instability Means for Global Energy Markets
- Energy and Defense Markets in Flux: Navigating Middle East Geopolitical Shifts and Budgetary Transitions
- Energy Market Volatility Reflects A Deeper Geopolitical Repricing
- War-Driven Energy Shock Complicates Shift to Renewables, Study Finds
- Energy Geopolitics in a Fragmented World: A Comparative Analysis of Europe and the Middle East
- Oil Prices Surge Amid Middle East Conflict in 2026
- How the U.S.-Iran War Will Catalyze Southeast Asian Corporates to Define Their Energy Future | Teneo
- Global Gas Market Dynamics and Strategic Investment Playbook
- PDF Public Disclosure Authorized ALGERIA ECONOMIC UPDATE
- PDF Global Economic Prospects -- January 2026
- Global Economic Prospects -- January 2026
- subregional profile 2024–2026
- [PDF] Macroeconomic and sectoral impact of US-Israel-Iran conflict
- [PDF] Algeria: 2025 Article IV Consultation-Press Release; and Staff Report
- CEA warns $130 crude could cut India’s GDP growth by 1%
- Oil shock for Asia: identifying the key pressure points | articles | ING THINK
- PDF World Bank Document
- [PDF] Recent trends and macroeconomic forecasts 2025-2027 - BCRP
- First Iran war inflation data to lock in RBA rate hike | PerthNow
- RBI highlights mixed economic trends in India as West Asia crisis impacts demand, supply
- A tumultuous month ahead for the economy and policy makers
- RBNZ Holds Firm: Interest Rates Steady Amidst Daunting Oil Shock Pressure | MEXC News
- Will the RBA choose a recession for Australia?
- ASX surges 2pc after modest gains on Wall St as Iran deadline looms
- Westpac and NAB Bank predict mega blow for Aussies with a mortgage: Hundreds more a month | Daily Mail Online
- Last domino falls: ANZ finally forecasts May RBA hike
- Australian unemployment rises as economy slows
- GDP growth falls to just 0.1% as household cutbacks put handbrake on Australia’s economy
- PDF The Great Rotation of 2026
- Markets have begun to climb the wall of worry - The Economic Times
- Gold and Silver Trading Just Got Cheaper as CME Lowers Margins - CaptainAltcoin
- Foreign Exchange Market Trends, Forecast & Insights 2026
- BIS Quarterly Review, March 2026
- New Research Reveals 60% of Crypto Traders Shifted Platforms in 24 Months as Exchange Loyalty Collapses - CaptainAltcoin
- Exchange Activity Hits Reset Levels: Healthy Pause or Bigger Breakdown?
- Coinbase Says Bitcoin Liquidity on Exchange Unfazed After SEC's Lawsuit Against Cumberland
- Ether Liquidity Plummets 40% On Exchanges After ETF Debut
- Algeria: Selected Issues Paper; IMF Country Report 12/22
- Emerging Global Energy Security Risks
- PDF Box 1: Assessment of international reserves adequacy
- PDF International Banking
- PDF 11 EXTERNAL SECTOR: WATCHFUL AND HOPE - indiabudget.gov.in
- The First Oil War: Implications of the Gulf Crisis in the ...
- [PDF] Transformative agenda for monetary and exchange rate policies
- [PDF] the impact of the global economic crisis on industrial development of ...
- PDF An Analytical Study of the Evolving Role of Third-Party Mediators in ...
- Resolving Corporate Governance Disputes
- The Strait of Hormuz Amid Current Wars in the World: Europe's Silent Mediators and the Path to Uncharted Alliances
- A Primary Health Care Approach for Hearing Health and its ...
- Vladimir Putin as a Mediator between Iran and the United ...
- From Script to Screen: The Importance of Copyright ...
- PDF Negotiating an End to the War in Ukraine: - Inclusive Peace
- On Peace in Times of War: Resolving Violent Conflicts by Peaceful Means - Juergen Dedring; The International Journal for Peace Studies
- The Role of Life Satisfaction and Optimism for Successful ...
- PDF Microsoft Word - Surprisingly Happy to Have Helped_Zhao and Epley_in press.docx
- Fed rate cut pushed back to late 2026 on war-related inflation risks: Reuters poll
- PDF Running on Empty?: War, supply chain shocks & the outlook.
- Fed’s Goolsbee says rate cuts may be delayed until 2027 amid oil prices
- April 2026 Economic and Market Update: Geopolitics at the Forefront - Crestwood Advisors
- What’s behind Nomura’s call for later Fed rate cuts?
- India Daily
- QNB expects the US Fed to cut twice in 2026 | The Peninsula Qatar
- Federal Reserve likely to stand pat on rates this week, deepening the gulf between Powell and Trump
- Federal Reserve likely to stand pat on rates this week, deepening the gulf between Powell and Trump - WTOP News
- Trapped Below Market Mean
- An Engine, Not a Camera
- PDF Option Profit and Loss Attribution and Pricing:
- PDF Risk-Management Fundamentals
- Clearing the Decks
- An Early Black Friday
- From Rally to Correction
- Stress Builds Below Resistance
- The Uptober Breakout
- PDF Trading Volatility
- Renewables Except Hydro Energy: Global Electricity Generation 2024 | Low-Carbon Power
- State of Climate Action
- PDF Environmental Impact Assessment for Renewable Energy Projects: Risks and Solutions in ...
- Revision Notes - Definitions and examples of each | Energy Resources and Consumption | Environmental Science | AP | Sparkl
- Sustainable Recovery - World energy Outlook Special Report
- Policies & action
- Advancing sustainability in urban transportation: A solar-powered metro rail system
- PDF Modelling and Simulation a Solar Farm Energy-Based Smart Grid for ...
- PDF Biomass Cofiring in Coal-Fired Boilers: Federal Energy ... - NREL
- PDF Biomass and waste incineration CHP: the co-benefits of primary energy ...
- Optimal Foreign Reserve Intervention and Financial ...
- March 13, 2026 - 10-K: Annual report [Section 13 and 15(d), not S-K Item 405] | Walmart Inc. (WMT)
- PDF Centre for Central Banking Studies - Bank of England
- Banking in sub-Saharan Africa - Recent Trends and Digital ...
- Annual Report 2016
- PDF US Monetary Policy and International Bond Markets
- A Closer Look at Emerging Market Resilience During Recent Shocks - Liberty Street Economics
- PDF 2026 Geostrategic Outlook - EY
- [PDF] The GPT Group 2025 Annual Report
- [PDF] 80TH INTEGRATED ANNUAL REPORT 2024-25 - Tata Motors
- annual report
- A short on the current scenario of fluctuations in commodity ...
- How is the conflict in the Middle East affecting developing economies? - Economics Observatory
- World Farmers Warn Middle East Crisis Threatens Global Food Security as Input Costs Surge - National Farmers Union
- Price volatility in agricultural markets | Markets and Trade | Food and Agriculture Organization of the United Nations
- Achieving food security in the face of climate change - CCAFS
- Sustainable agricultural development for food security and ...
- The Association Between Food Surplus Costs and Retail Prices – Food-Fueled
- [PDF] The future of Food and Farming - final report - GOV.UK
- [PDF] Shock Waves: Managing the Impacts of Climate Change on Poverty
- impact of the world oil market on the economies of gulf ...
- Not All Oil Price Shocks Are Alike:
- WTO | Publications - Oil Price Volatility: Origins and Effects
- wiiw Research Report 346: Economic and Trade Policy ...
- Modelling inflation dynamics and global oil price shocks in ...
- PDF Association Among Cpi, Iip and Crude Oil Price in India
- Iran War Oil Price Impact: Economic Shockwaves Reshape
- [PDF] Oil price assumptions for macroeconomic policy
- PDF US Iran 2 - fpam.org.my
- PDF ECB staff macroeconomic projections for the euro area
- PDF Exploring Volatility: Evolution, Advancements, Trends, and Applications
- PDF Dyn_Leveraging_the_Low_Volatility_Effect_2025-02_Layout 1
- PDF Comparative Analysis of Optimal Strategies Based On 6 Stocks
- PDF Rational rebalancing: An analytical approach to multiasset portfolio ...
- THE PARADOX OF LOW-RISK STOCKS
- PDF Integrating LSTM with Fama-French six factor model for predicting
- Trading in Low Volatility: Strategies That Work When VIX Is Below 15 - Volatility Box
- Investors turn to tax-loss harvesting amid market volatility
- PDF The Case for Crypto in an Institutional Portfolio
- Tax-Loss Harvesting: What Is It and How Does It Work?
- INTERNATIONAL JOURNAL OF CENTRAL BANKING
- Evolving Monetary Policy Frameworks in Low-Income and ...
- i Working Paper 6/2014 ALTERNATIVE MONETARY ...
- How Risky is Financial Liberalization in the Developing ...
- Journal of Business Administration
- [PDF] Argentina, Brazil, China, India and South Korea - EconStor
- Managing Capital - Flows in East Asia - World Bank Document
- [PDF] Pensions, Savings and Capital Flows | OECD
- Lessons From The Crisis And Challenges For Coming Years
- Strategies for Affordable and Fair Clean Energy Transitions
- Nuclear Energy Cooperation with Foreign Countries
- Global Market Analysis of Microreactors
- PDF Annual Energy Outlook 2026
- Nuclear Power Development Orientation in Vietnam
- French strategy for energy and climate
- Batteries and Secure Energy Transitions - Microsoft .NET
- [PDF] Technical assessment of nuclear energy with respect to the 'do no ...
- Japan South Korea Nuclear Growth Accelerates in 2026
- Taking Stock 2025